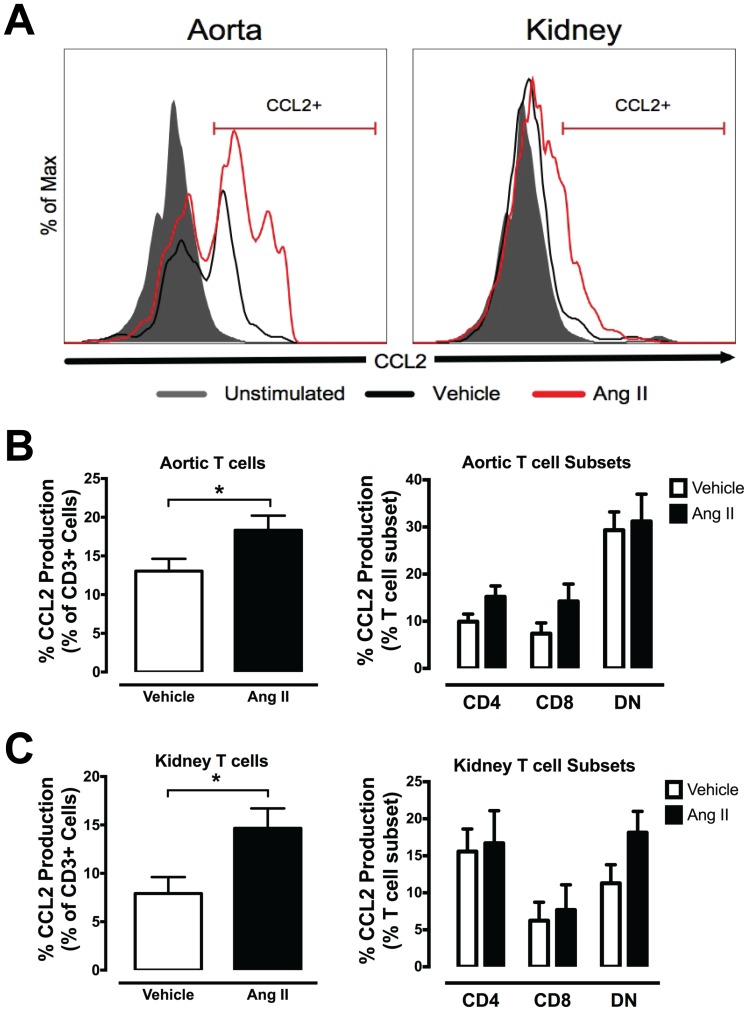
Figure 3. Intracellular FACS analysis of CCL2-producing T cells from aorta and kidney.
(A) Representative histograms and gating strategy of CCL2+ T cells from aorta (left) and kidney (right) of vehicle and Ang II-infused mice. (B) Mean data of aortic and (C) kidney T cells (left) and T cell subsets (right) that produce CCL2 in response to PMA-ionomycin stimulation. (*P<0.05 Vs vehicle; Unpaired t test; n = 5–10).

