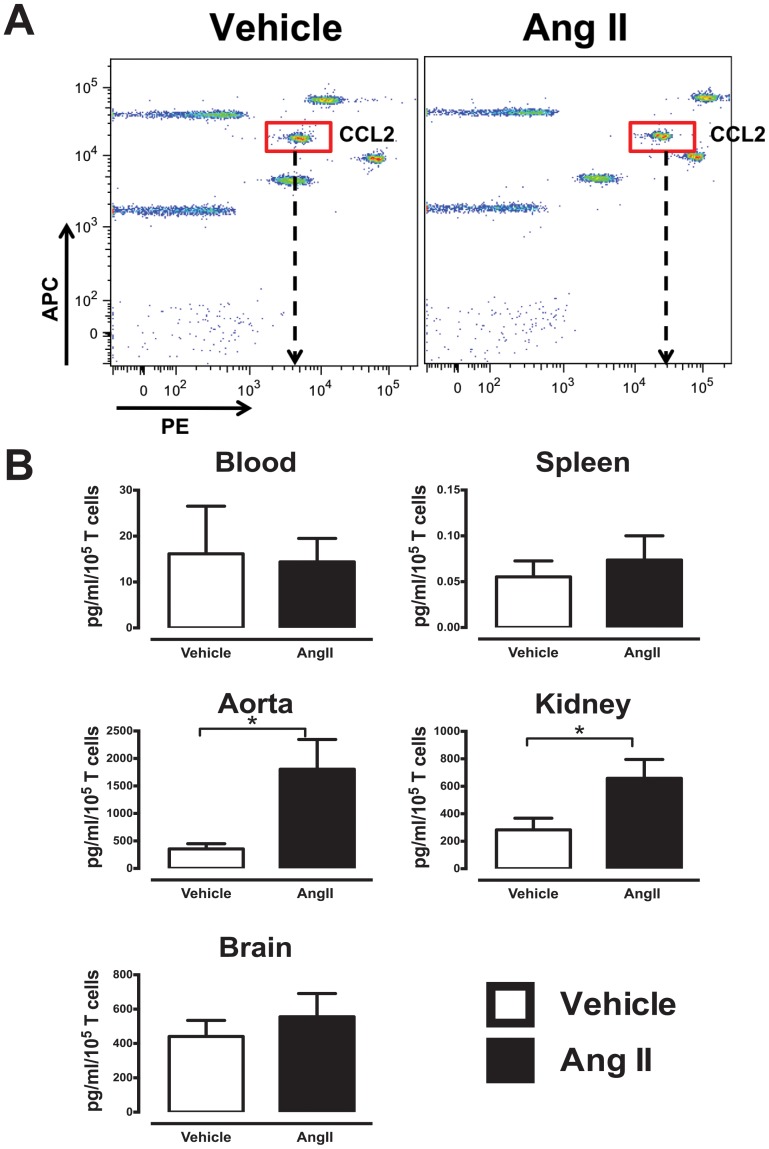
Figure 5. Infiltrating T cells from hypertensive mice produce greater CCL2.
(A) Representative CBA assays plot and gating of CCL2 in a vehicle and Ang II aortic sample. Arrow denotes the mean fluorescence intensity of each sample. (B) Quantitative analysis of amount of CCL2 produced using CBA assay. Data represented as total amount of cytokine produced in pg/ml per 105 T cells in blood, spleen, aorta, kidney and brain (n = 11–22). (*P<0.05 Vs vehicle; Unpaired T test; n = 7–8).

