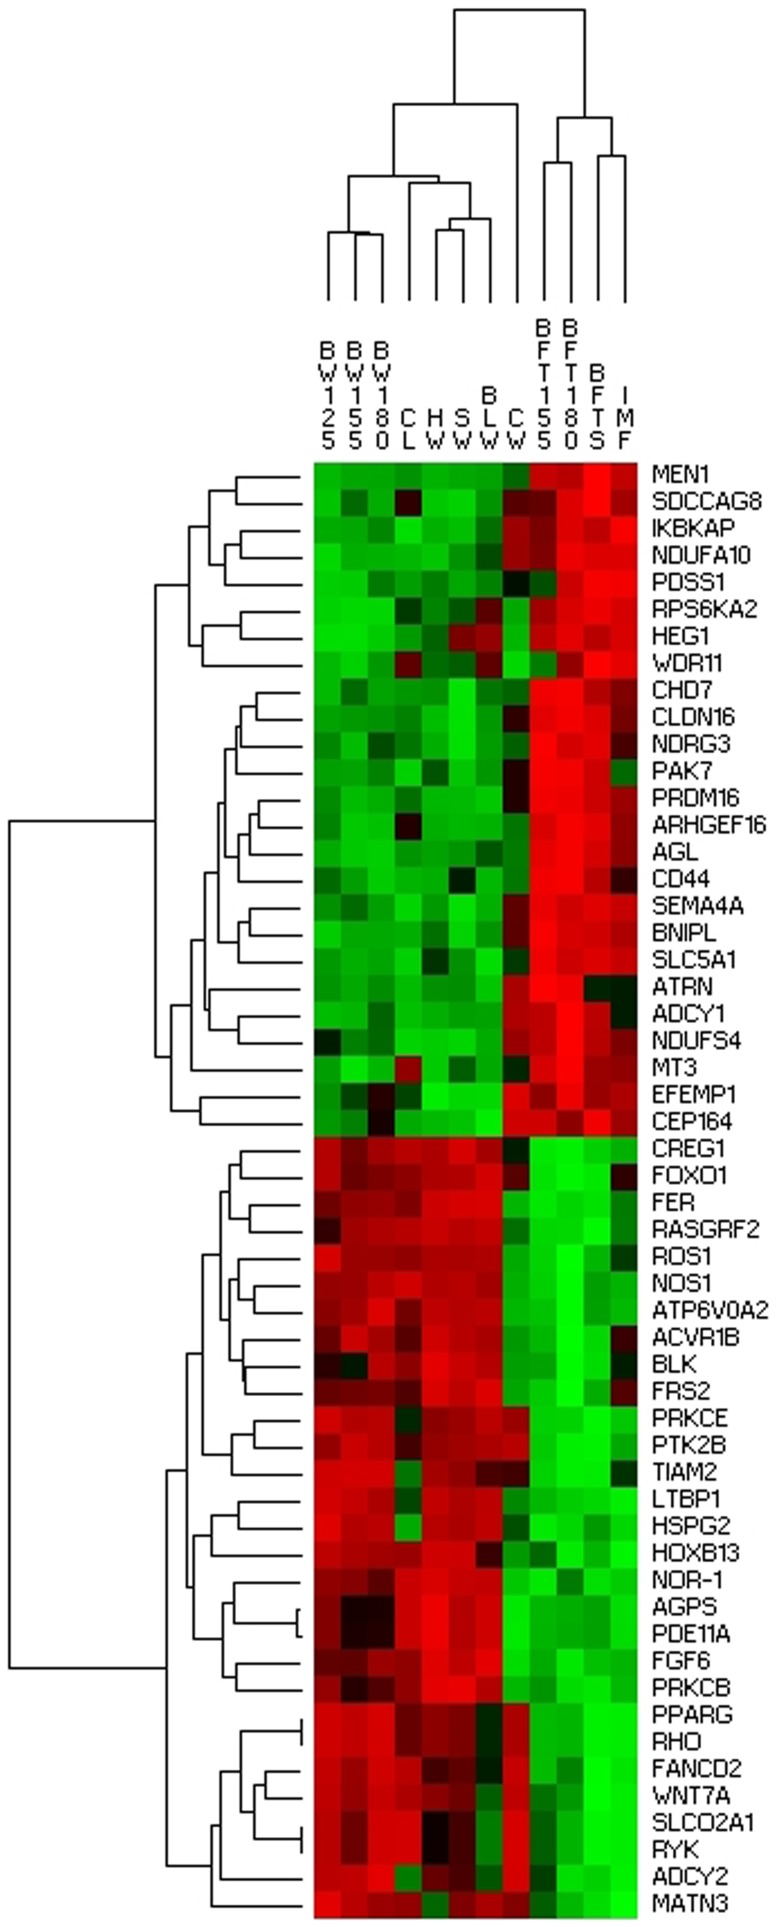
Figure 2. Hierarchical cluster analysis considering only those genes in the network related with growth (S1 Table) among 12 phenotypic traits.
The green colour in the figure corresponds to negative SNP additive effect values and red to positive SNP additive effect values.

