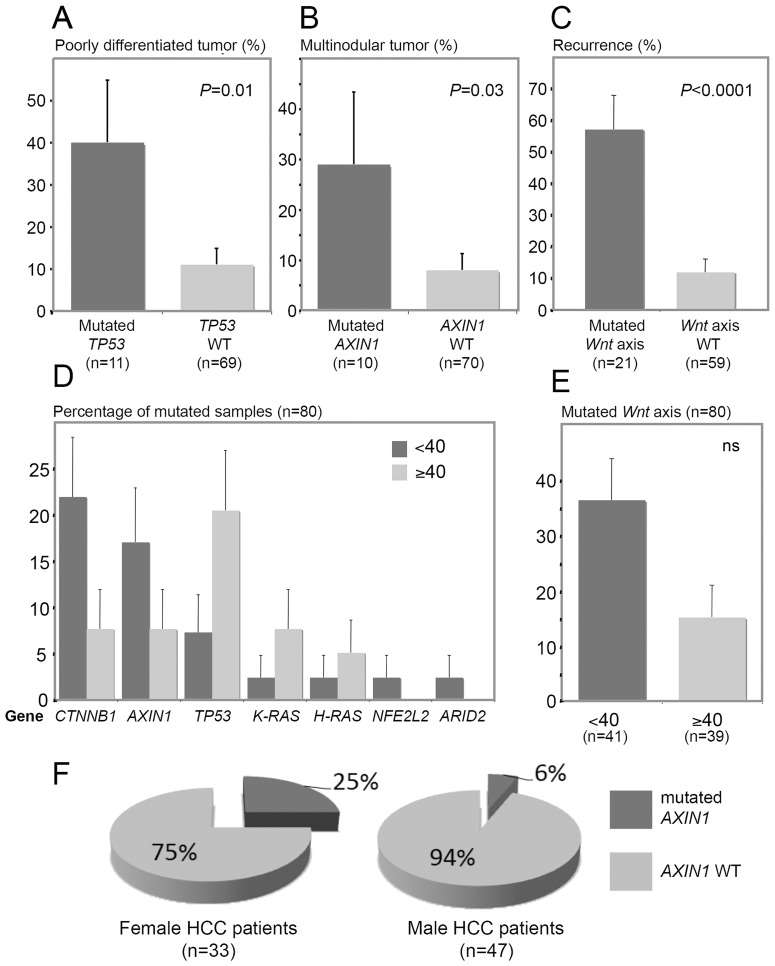
Figure 3. Age-based tumor phenotype and clinical pattern of the Peruvian HCCs are correlated to specific somatic mutation rates.
(A–E) Bar charts illustrating the association between HCC-related gene mutation rates (%) and tumor clinical presentation. (A–C,E) Black bars represent the mutation rate; grey bars represent the wild-type allele (WT) rate. (A) WT and mutation rates of TP53 gene in E.S.3 HCCs (P = 0.01). (B) WT and mutation rates of AXIN1 gene in multinodular HCCs (P = 0.03). (C) WT and mutation rates of Wnt axis in recurring HCCs (P<0.0001). (D) Bar chart of the mutation rates of ARID2, AXIN1, CTNNB1, H-RAS, K-RAS, NFE2L2, and TP53 genes in <40 and ≥40 patients (black and grey bars, respectively). (E) Bar chart presenting mutation rate of Wnt axis in <40 and ≥40 HCCs. Black and grey bars represent <40 and ≥40 patient rates, respectively. (A–E) Error bars represent the standard errors of the counts. (F) Pie charts for both mutation and WT rates of AXIN1 gene in HCCs of female (left chart) and male (right chart) patients. Black sectors represent the AXIN1 mutation rates; grey sectors represent the rates of AXIN1 WT.

