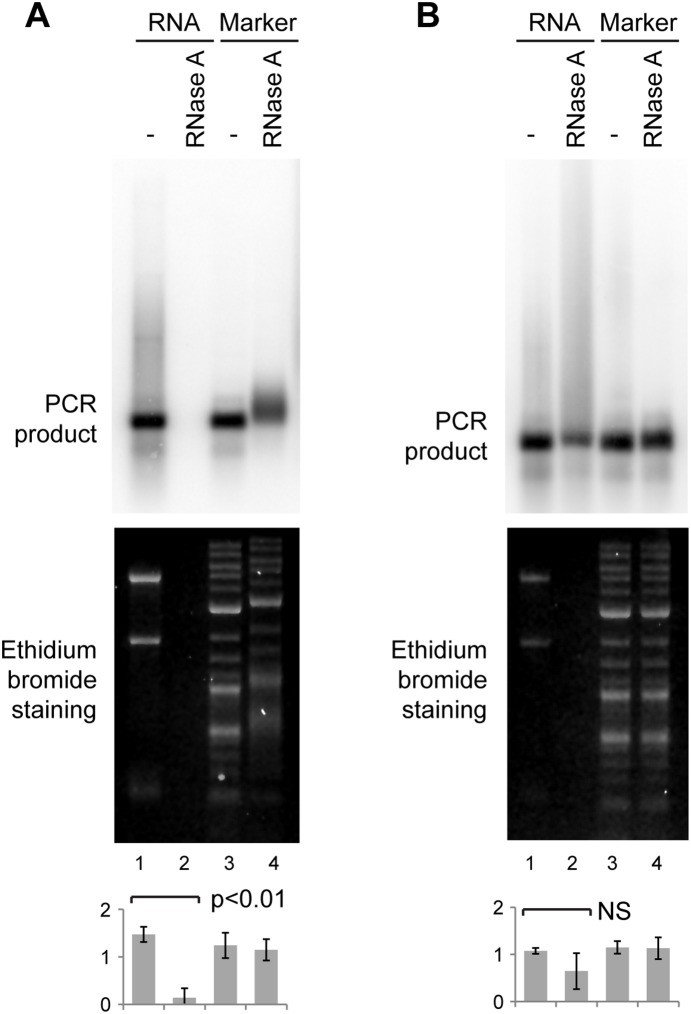
Figure 3. Inhibition of DNA removal by RNase A.
A: 0.5 ng major satellite PCR product was mixed with 1 µg NIH/3T3 RNA (lanes 1, 2) or with 1 µg DNA molecular weight marker (lanes 3, 4), and treated without or with RNase A followed by phenol:chloroform extraction and analysis as in Fig. 1. B: Identical to A, except that samples were incubated with 20 µg proteinase K for 15 min at 37° after RNase A treatment and phenol:chloroform extraction was omitted. For quantification, error bars represent ±1 s.d., y-axes in arbitrary units, analysis by one-way ANOVA (n = 3), differences in B are not significant.

