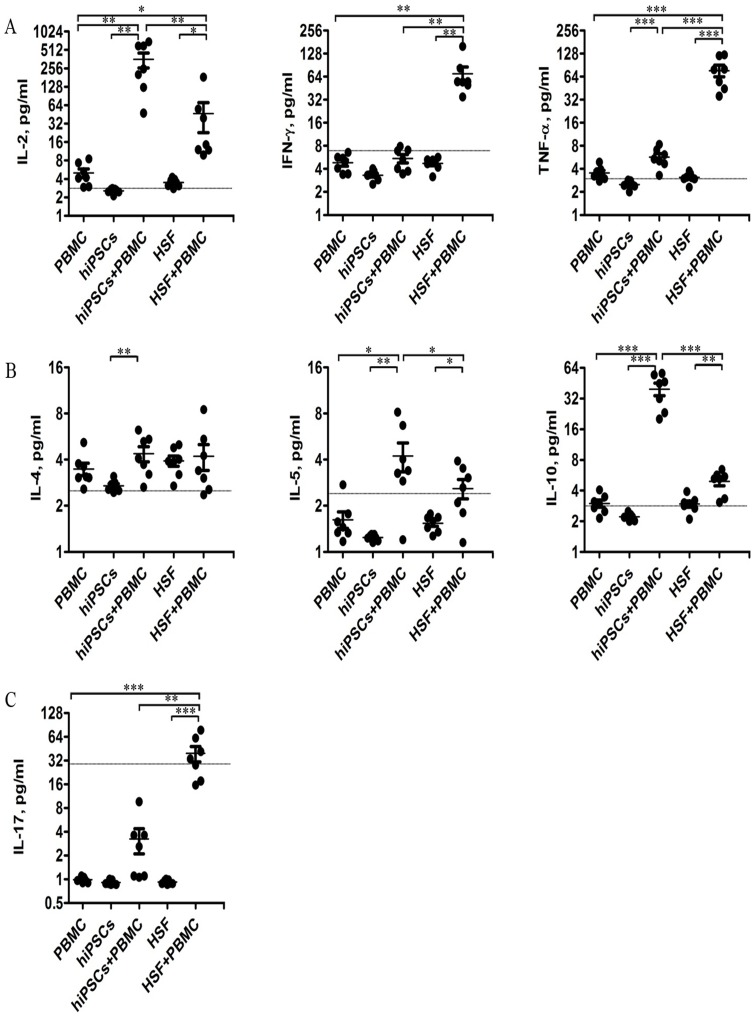
Figure 5. Cytokine expression profile in MLR.
Culture supernatants were collected from the MLR after 24 hours of culture and examined for expression of cytokines secreted by Th1 (A), Th2 (B), and Th17 (C) (n = 7). Data shown are single values for each point in the scatter plot. * P<0.05; ** P<0.01; *** P<0.001. The grey lines indicate the sensitivity of each cytokine.

