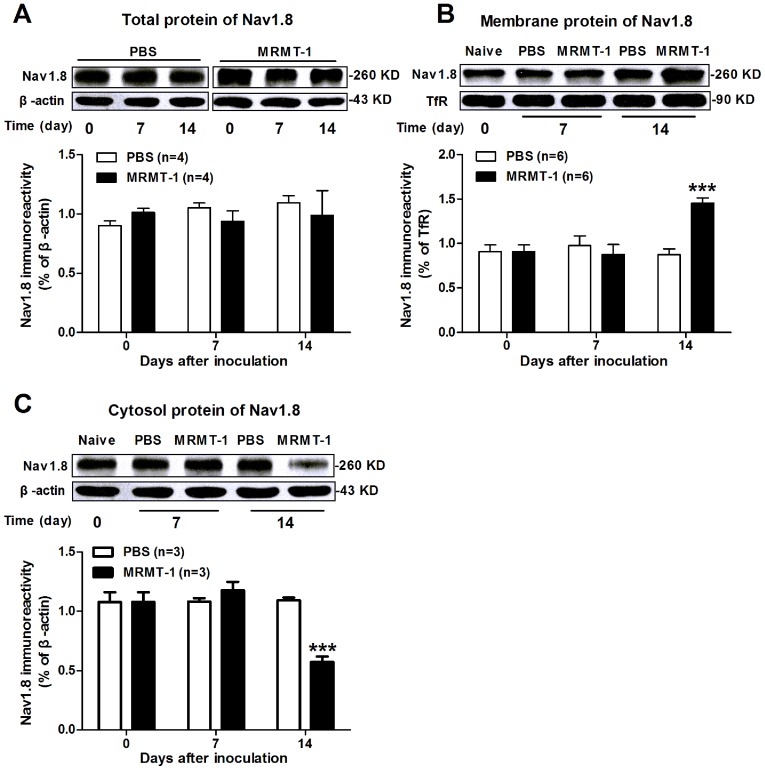
Figure 3. Expression of Nav1.8 protein in the DRG in naïve, PBS-treated and MRMT-1-treated rats.
(A): Total Nav1.8 protein. Upper: representative of Western blot bands; Lower: statistical analysis of Nav1.8 total protein expression. No significant difference is observed on the expression of Nav1.8 total protein among the three groups. P>0.05, two-way ANOVA, n = 4/group. (B): Nav1.8 membrane protein. Upper: representative of Western blot bands. Transferrin receptor (TfR) is used as internal control. Lower: statistical analysis of Nav1.8 membrane protein expression. Note that the expression of Nav1.8 on the cell membrane is increased significantly in the DRG neurons of MRMT-1-treated rats compared to PBS-treated rats. *** P<0.001, two-way ANOVA, n = 6/group. (C): Nav1.8 protein in the cytosol. Note that the expression of Nav1.8 in the cytosol is significantly decreased in the DRG neurons of MRMT-1-treated rats compared to PBS-treated rats. *** P<0.001, two-way ANOVA, n = 3/group.

