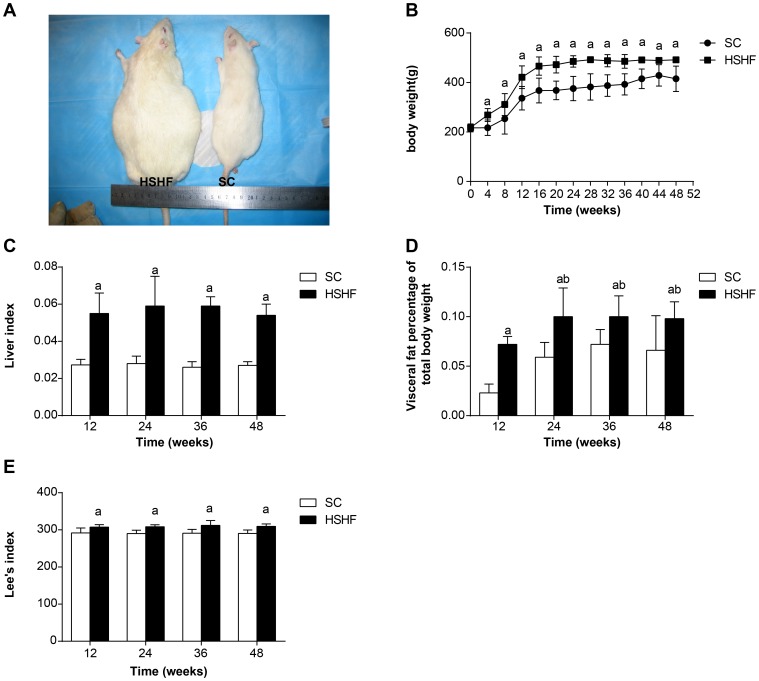
Figure 1. The changes of weight, Lee's index, liver index and fat percentages in different groups per month.
A. Comparison of rats. B. Comparison of body weight. C. Comparison of liver index. D. Comparison of fat percentages. E. Comparison of Lee's index. SC: standard chow group; HSHF: high sugar and high fat diet group; a p<0.05 vs normal control; b p<0.05 vs 12th week group; c p<0.05 vs 24th week group; b p<0.05 vs 36th week group.

