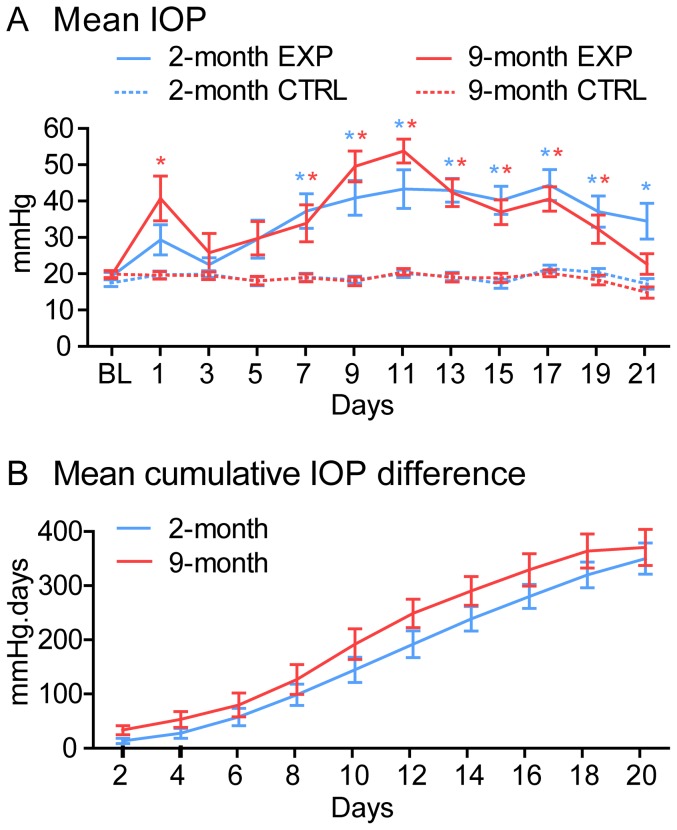
Figure 1. IOP elevation.
(A) Mean IOP versus time. There was a significant difference between experimental and fellow control eyes within each age group, but not between age groups. (B) Mean cumulative inter-eye IOP difference versus time. Cumulative IOP difference increased as expected with time, but there was no difference between age groups. Error bars = SEM. * indicates p<0.05 when comparing experimental and fellow control eyes (Bonferroni). Abbreviations: EXP = experimental eyes, CTRL = fellow control eyes, BL = baseline.

