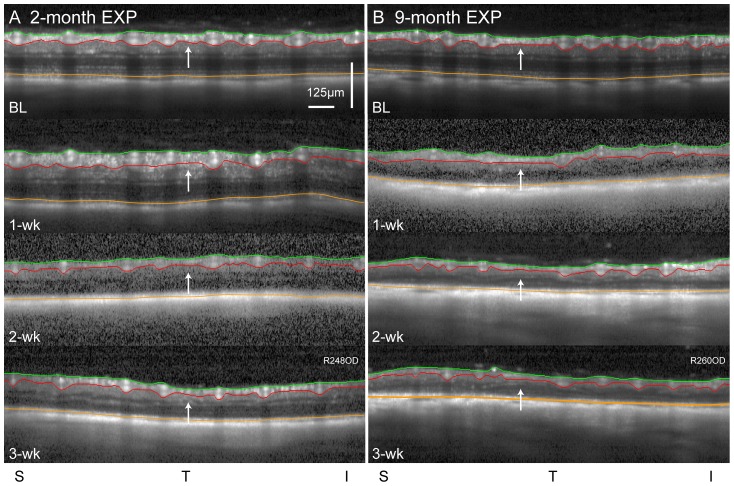
Figure 2. Peri-papillary SD-OCT B-scans.
B-scans are shown for a single representative rat from the 2-month (A) and 9-month (B) age groups at baseline and at 1-, 2- and 3-weeks (wk) after chronic, unilateral IOP elevation. Segmentations of the inner limiting membrane (green), outer border of the nerve fiber layer (red) and Bruch's membrane/retinal pigment epithelium complex (orange) are marked, and were used to derive longitudinal measures of peripapillary RNFLT (green to red) and RT (green to orange). In the 2-month eye, arrows point to a region of the RNFL that shows initial thickening at 1-week, followed by thinning at 2- and 3-weeks. In the 9-month eye, arrows show a region of RNFL undergoing progressive thinning beginning at 1-week. Abbreviations: EXP = experimental eye, S = superior, T = temporal, I = inferior. Scale applies A-F.

