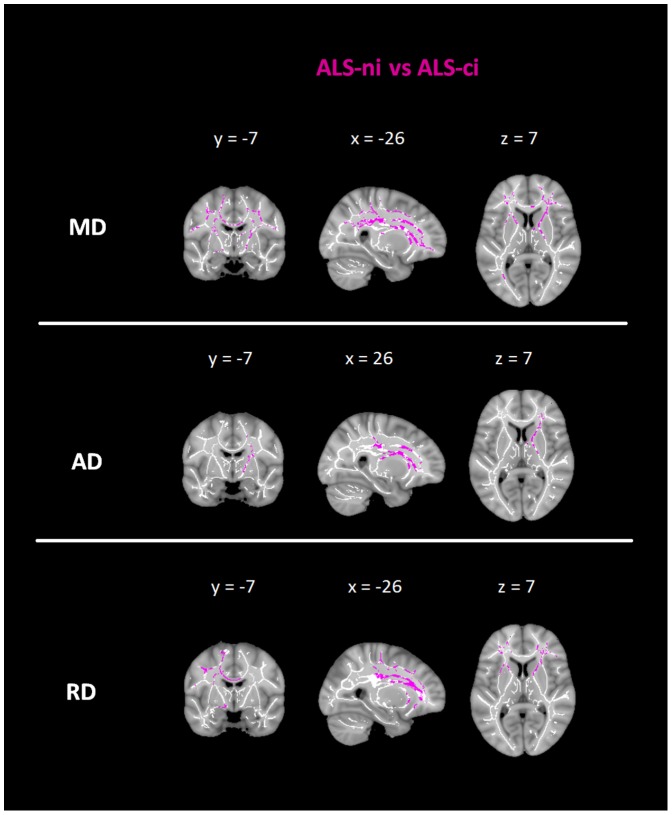
Figure 2. Group comparisons of diffusivity values between ALS-ni patients and ALS-ci patients.
Effect of group differences along the TBSS fiber tract skeleton. Effects were thresholded at p<0.05, corrected for multiple comparisons. Violet: comparison between cognitively intact ALS-patients to cognitively impaired ALS-patients; MD = mean diffusivity; AD = axial diffusivity; RD = radial diffusivity

