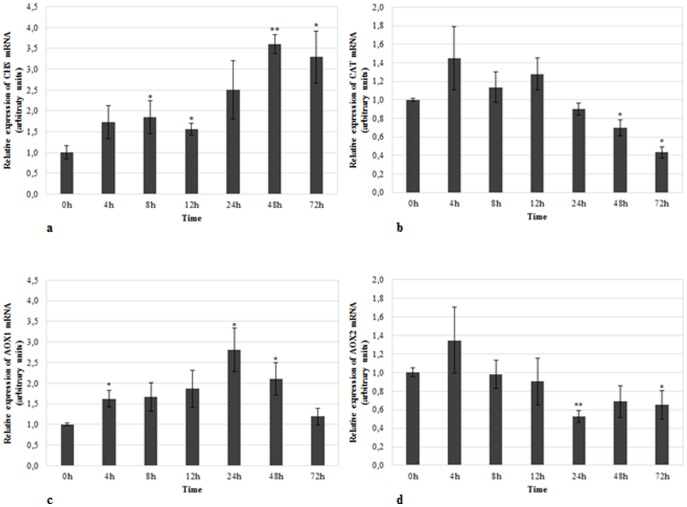
Figure 3. Relative mRNA expression of target genes in cold-treated samples.
Expression of a) CHS, b) CAT, c) AOX1, and d) AOX2 in cold-treated samples using TUB, GSA and GAPDH as reference genes in data normalization. The relative expression values are depicted as the mean ± standard deviation of three biological replicates and correspond to the ratio between treated and untreated samples for each time point. The bars represent the fold-change related to control group (0 hours) which was set to 1. Statistical significances (*p≤0.05 and **p≤0.01) between the two means were determined by the t-test using IBM SPSS Statistics version 22.0 (SPSS Inc., USA).

