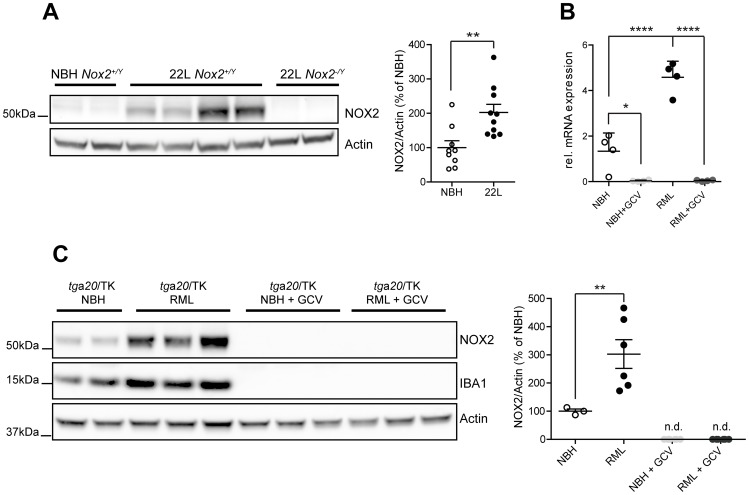
Figure 3. Analysis of NOX2 expression and cellular localization in mice.
(A) Western blot of brain homogenates from Nox2+/Y and Nox2-/Y mice injected i.c. with prions (22 L) or non-infectious brain homogenate (NBH) using antibodies to NOX2 and Actin. Densitometric quantitation of NOX2 signal in Nox2+/Y samples was normalized over Actin signal. Scatter dot plot shows NOX2 relative signal intensity as percentage of NBH samples; each dot corresponds to a mouse (NBH, n = 9; 22 L, n = 10; **, P = 0.0044; Student's t test). (B) Quantitative RT-PCR analysis of Nox2 expression in cerebellar slice cultures from tga20/TK pups treated with NBH or prions (RML), with or without addition of ganciclovir (GCV). Significantly reduced Nox2 expression levels are detected upon microglia depletion with ganciclovir; each dot corresponds to a pool of 6–9 cerebellar slices cultured in the same well (n = 4 pools; *, P<0.05; ****, P<0.0001; one-way ANOVA followed by Bonferroni's post-hoc test). (C) Western blot of cerebellar slice homogenates from tga20/TK pups treated with NBH or prions (RML), with or without addition of GCV using NOX2, IBA1 or Actin antibodies. Densitometric quantitation of NOX2 signal was normalized over Actin signal. Scatter dot plot represents NOX2 relative signal intensity as percentage of NBH samples; each dot corresponds to a pool of 6-9 cerebellar slices cultured in the same well (NBH, n = 3 pools; RML, n = 6 pools; NBH+GCV, n = 6 pools; RML+GCV, n = 6 pools; **, P<0.001; one-way ANOVA followed by Bonferroni's post-hoc test).

