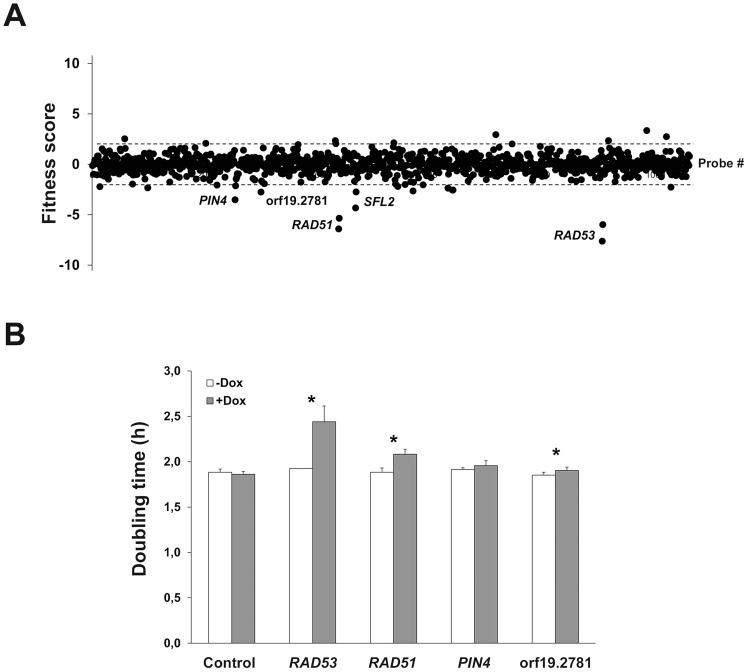
Figure 2. Identification of genes whose overexpression alters planktonic cell fitness.
(A) The effect of gene overexpression on cell growth was tested in GHAUM medium at 30°C in the absence or presence of 50 µg.mL−1 doxycycline for 16 generations. The experiment was conducted twice independently (n = 2 biological replicates). Samples were subjected to genomic DNA extraction followed by PCR-amplification of the barcodes, indirect fluorescent dye labeling (Dox-treated sample: Cy5-labeled; untreated control: Cy3-labeled) and hybridization to a barcode microarray with both forward and reverse complemented probes for every barcode (two black circles next to each gene name/orf19 nomenclature represent forward and reverse complemented probe sequences). Fitness scores (Z-score for each tag) are shown on the y-axis. The corresponding probe number ranked using the orf19 nomenclature in ascending order is shown on the x-axis. Z-score calculations were performed using Arraypipe v2.0. Dashed lines correspond to the Z-score values +2.0 (upper line) and −2.0 (lower line). Names or orf19 nomenclature of some of the genes whose overexpression alters strain fitness are shown. (B) Confirmation of the microarray data by liquid growth assay of strains overexpressing RAD53, RAD51, PIN4, and ORF19.2781 grown three times independently. Doubling time in hours (mean from n = 3 and error bars denote standard deviations) is indicated on the y-axis for each strain in the absence (white bar) or presence (gray bar) of 50 µg.mL−1 doxycycline (Dox); statistical significance was assigned (p≤0.05, asterisks) by performing 2-tailed Student's t-tests and assuming groups of equal variances.

