
Table 1.
Demographic characteristics of participants
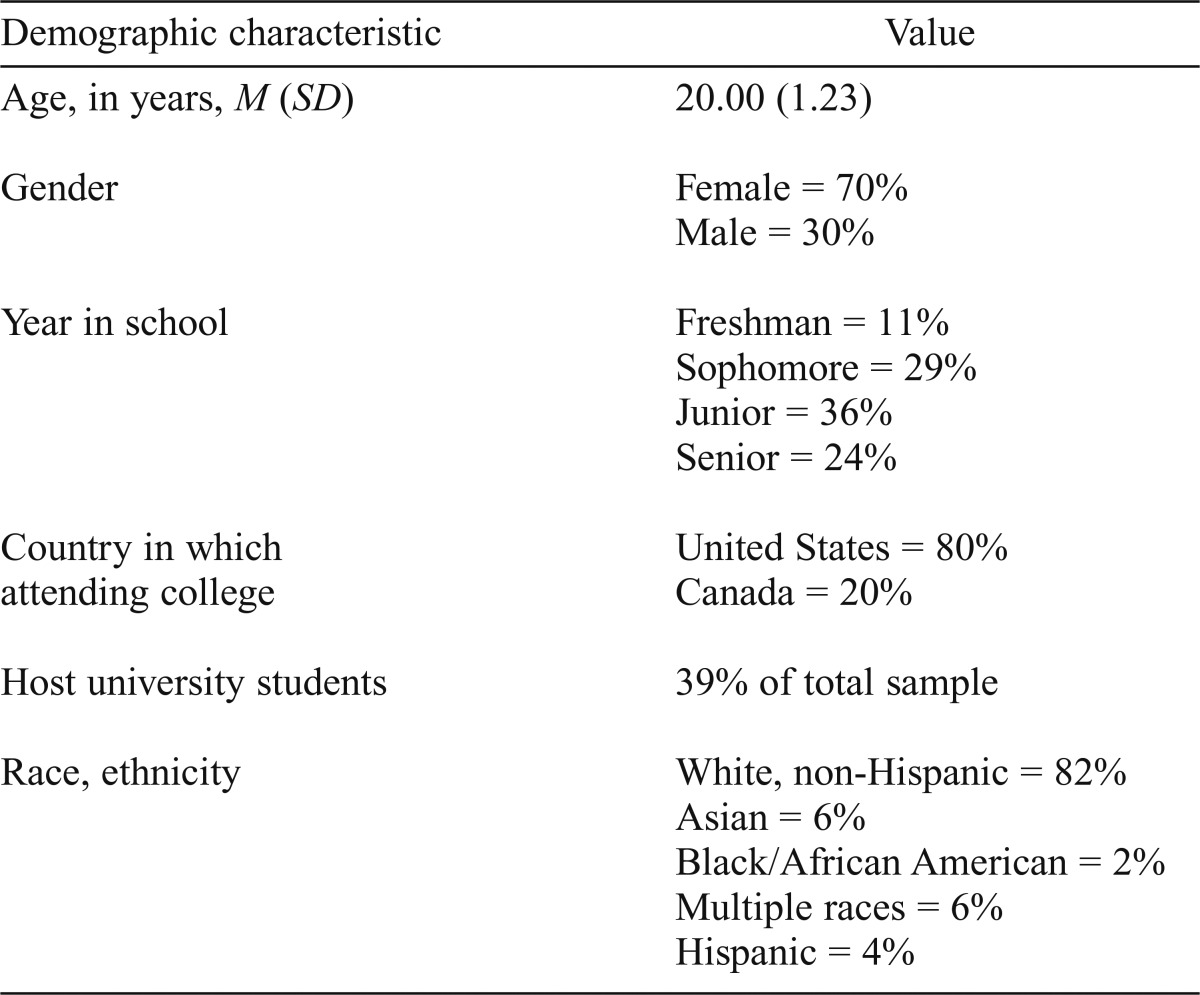
| Demographic characteristic | Value |
| Age, in years, M (SD) | 20.00 (1.23) |
| Gender | Female = 70% |
| Male = 30% | |
| Year in school | Freshman = 11 % |
| Sophomore = 29% | |
| Junior = 36% | |
| Senior = 24% | |
| Country in which attending college | United States = 80% |
| Canada = 20% | |
| Host university students | 39% of total sample |
| Race, ethnicity | White, non-Hispanic = 82% |
| Asian = 6% | |
| Black/African American = 2% | |
| Multiple races = 6% | |
| Hispanic = 4% |