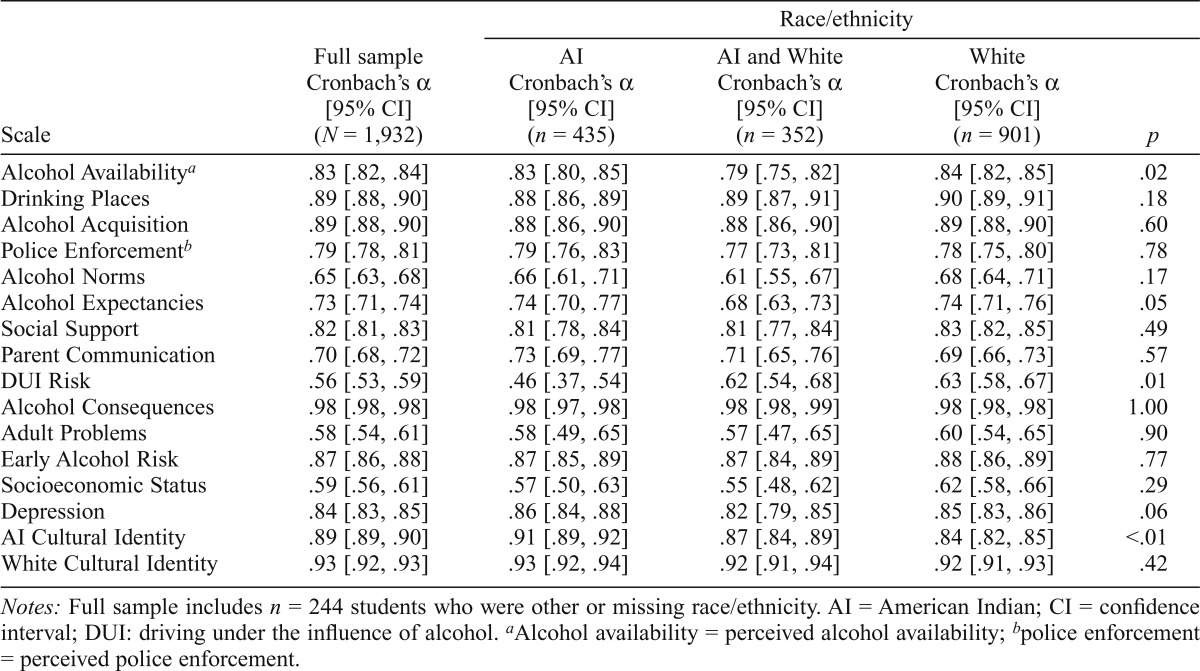
Table 1.
Internal consistency estimates (Cronbach’s α) at Wave 1 for full sample and by race/ethnicity

| Race/ethnicity |
|||||
| Scale | Full sample Cronbach’s α [95% CI] (N = 1,932) | AI Cronbach’s α [95% CI] (n = 435) | AI and White Cronbach’s α [95% CI] (n = 352) | White Cronbach’s α [95% CI] (n = 901) | p |
| Alcohol Availabilitya | .83 [.82, .84] | .83 [.80, .85] | .79 [.75, .82] | .84 [.82, .85] | .02 |
| Drinking Places | .89 [.88, .90] | .88 [.86, .89] | .89 [.87, .91] | .90 [.89, .91] | .18 |
| Alcohol Acquisition | .89 [.88, .90] | .88 [.86, .90] | .88 [.86, .90] | .89 [.88, .90] | .60 |
| Police Enforcementb | .79 [.78, .81] | .79 [.76, .83] | .77 [.73, .81] | .78 [.75, .80] | .78 |
| Alcohol Norms | .65 [.63, .68] | .66 [.61, .71] | .61 [.55, .67] | .68 [.64, .71] | .17 |
| Alcohol Expectancies | .73 [.71, .74] | .74 [.70, .77] | .68 [.63, .73] | .74 [.71, .76] | .05 |
| Social Support | .82 [.81, .83] | .81 [.78, .84] | .81 [.77, .84] | .83 [.82, .85] | .49 |
| Parent Communication | .70 [.68, .72] | .73 [.69, .77] | .71 [.65, .76] | .69 [.66, .73] | .57 |
| DUI Risk | .56 [.53, .59] | .46 [.37, .54] | .62 [.54, .68] | .63 [.58, .67] | .01 |
| Alcohol Consequences | .98 [.98, .98] | .98 [.97, .98] | .98 [.98, .99] | .98 [.98, .98] | 1.00 |
| Adult Problems | .58 [.54, .61] | .58 [.49, .65] | .57 [.47, .65] | .60 [.54, .65] | .90 |
| Early Alcohol Risk | .87 [.86, .88] | .87 [.85, .89] | .87 [.84, .89] | .88 [.86, .89] | .77 |
| Socioeconomic Status | .59 [.56, .61] | .57 [.50, .63] | .55 [.48, .62] | .62 [.58, .66] | .29 |
| Depression | .84 [.83, .85] | .86 [.84, .88] | .82 [.79, .85] | .85 [.83, .86] | .06 |
| AI Cultural Identity | .89 [.89, .90] | .91 [.89, .92] | .87 [.84, .89] | .84 [.82, .85] | <.01 |
| White Cultural Identity | .93 [.92, .93] | .93 [.92, .94] | .92 [.91, .94] | .92 [.91, .93] | .42 |
Notes: Full sample includes n = 244 students who were other or missing race/ethnicity. AI = American Indian; CI = confidence interval; DUI: driving under the influence of alcohol.
Alcohol availability = perceived alcohol availability;
police enforcement = perceived police enforcement.
