
Table 3.
Client arrest rates in year following a new episode of outpatient treatment by race/ethnicity and engagement status
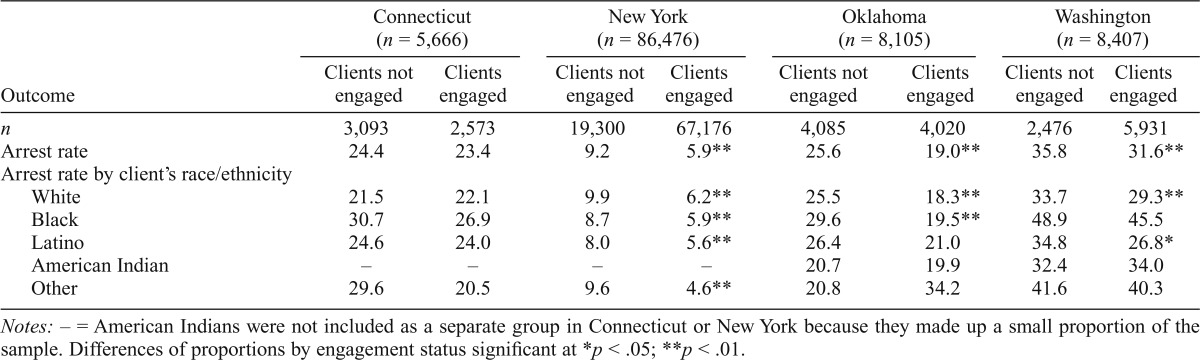
| Outcome | Connecticut (n = 5,666) |
New York (n = 86,476) |
Oklahoma (n = 8,105) |
Washington (n = 8,407) |
||||
| Clients not engaged | Clients engaged | Clients not engaged | Clients engaged | Clients not engaged | Clients engaged | Clients not engaged | Clients engaged | |
| n | 3,093 | 2,573 | 19,300 | 67,176 | 4,085 | 4,020 | 2,476 | 5,931 |
| Arrest rate | 24.4 | 23.4 | 9.2 | 5.9** | 25.6 | 19.0** | 35.8 | 31.6** |
| Arrest rate by client’s race/ethnicity | ||||||||
| White | 21.5 | 22.1 | 9.9 | 6.2** | 25.5 | 18.3** | 33.7 | 29.3** |
| Black | 30.7 | 26.9 | 8.7 | 5.9** | 29.6 | 19.5** | 48.9 | 45.5 |
| Latino | 24.6 | 24.0 | 8.0 | 5.6** | 26.4 | 21.0 | 34.8 | 26.8* |
| American Indian | – | – | – | – | 20.7 | 19.9 | 32.4 | 34.0 |
| Other | 29.6 | 20.5 | 9.6 | 4.6** | 20.8 | 34.2 | 41.6 | 40.3 |
Notes: – = American Indians were not included as a separate group in Connecticut or New York because they made up a small proportion of the sample. Differences of proportions by engagement status significant at
*
p < .05;
**
p < .01.