
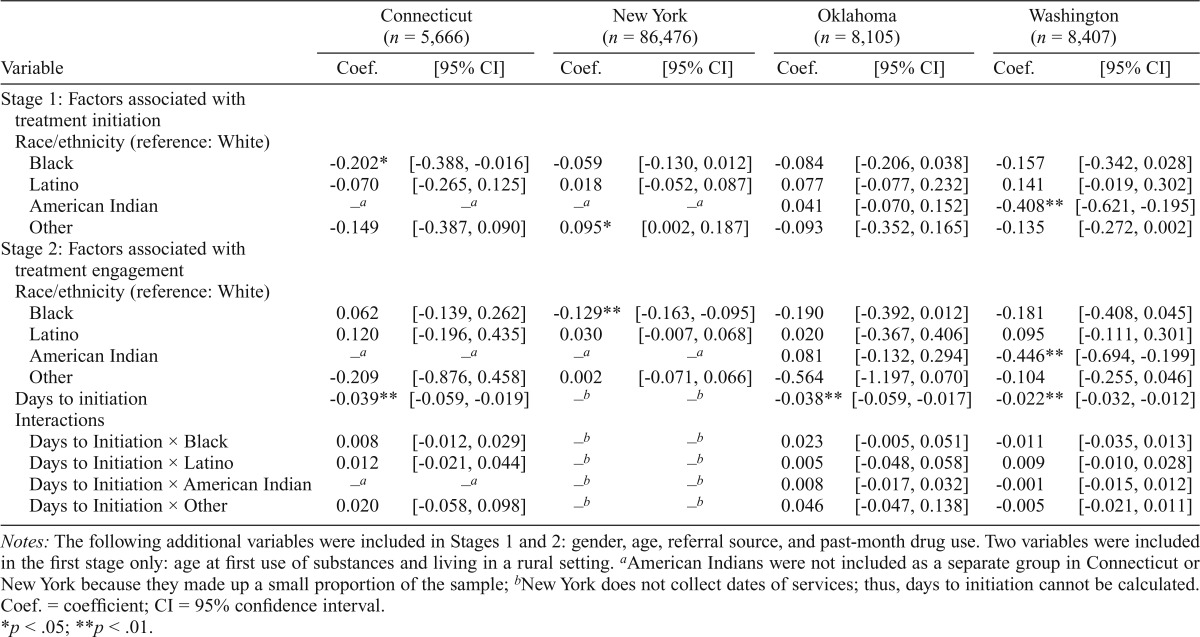
Table 4.
Results of two-stage probit regression predicting treatment initiation and engagement (not including socioeconomic variables)
| Variable | Connecticut (n = 5,666) |
New York (n = 86,476) |
Oklahoma (n = 8,105) |
Washington (n = 8,407) |
||||
| Coef. | [95% CI] | Coef. | [95% CI] | Coef. | [95% CI] | Coef. | [95% CI] | |
| Stage 1: Factors associated with treatment initiation | ||||||||
| Race/ethnicity (reference: White) | ||||||||
| Black | -0.202* | [-0.388, -0.016] | -0.059 | [-0.130, 0.012] | -0.084 | [-0.206, 0.038] | -0.157 | [-0.342, 0.028] |
| Latino | -0.070 | [-0.265, 0.125] | 0.018 | [-0.052, 0.087] | 0.077 | [-0.077, 0.232] | 0.141 | [-0.019, 0.302] |
| American Indian | –a | –a | –a | –a | 0.041 | [-0.070, 0.152] | -0.408** | [-0.621, -0.195] |
| Other | -0.149 | [-0.387, 0.090] | 0.095* | [0.002, 0.187] | -0.093 | [-0.352, 0.165] | -0.135 | [-0.272, 0.002] |
| Stage 2: Factors associated with treatment engagement | ||||||||
| Race/ethnicity (reference: White) | ||||||||
| Black | 0.062 | [-0.139, 0.262] | -0.129** | [-0.163, -0.095] | -0.190 | [-0.392, 0.012] | -0.181 | [-0.408, 0.045] |
| Latino | 0.120 | [-0.196, 0.435] | 0.030 | [-0.007, 0.068] | 0.020 | [-0.367, 0.406] | 0.095 | [-0.111, 0.301] |
| American Indian | –a | –a | –a | –a | 0.081 | [-0.132, 0.294] | -0.446** | [-0.694, -0.199] |
| Other | -0.209 | [-0.876, 0.458] | 0.002 | [-0.071, 0.066] | -0.564 | [-1.197, 0.070] | -0.104 | [-0.255, 0.046] |
| Days to initiation | -0.039** | [-0.059, -0.019] | –b | –b | -0.038** | [-0.059, -0.017] | -0.022** | [-0.032, -0.012] |
| Interactions | ||||||||
| Days to Initiation × Black | 0.008 | [-0.012, 0.029] | –b | –b | 0.023 | [-0.005, 0.051] | -0.01 | [-0.035, 0.013] |
| Days to Initiation × Latino | 0.012 | [-0.021, 0.044] | –b | –b | 0.005 | [-0.048, 0.058] | 0.009 | [-0.010, 0.028] |
| Days to Initiation × American Indian | –a | –a | –b | –b | 0.008 | [-0.017, 0.032] | -0.001 | [-0.015, 0.012] |
| Days to Initiation × Other | 0.020 | [-0.058, 0.098] | –b | –b | 0.046 | [-0.047, 0.138] | -0.005 | [-0.021, 0.011] |
Notes: The following additional variables were included in Stages 1 and 2: gender, age, referral source, and past-month drug use. Two variables were included in the first stage only: age at first use of substances and living in a rural setting.
a
American Indians were not included as a separate group in Connecticut or New York because they made up a small proportion of the sample;
b
New York does not collect dates of services; thus, days to initiation cannot be calculated. Coef. = coefficient; CI = 95% confidence interval.
*
p < .05;
**
p < .01.