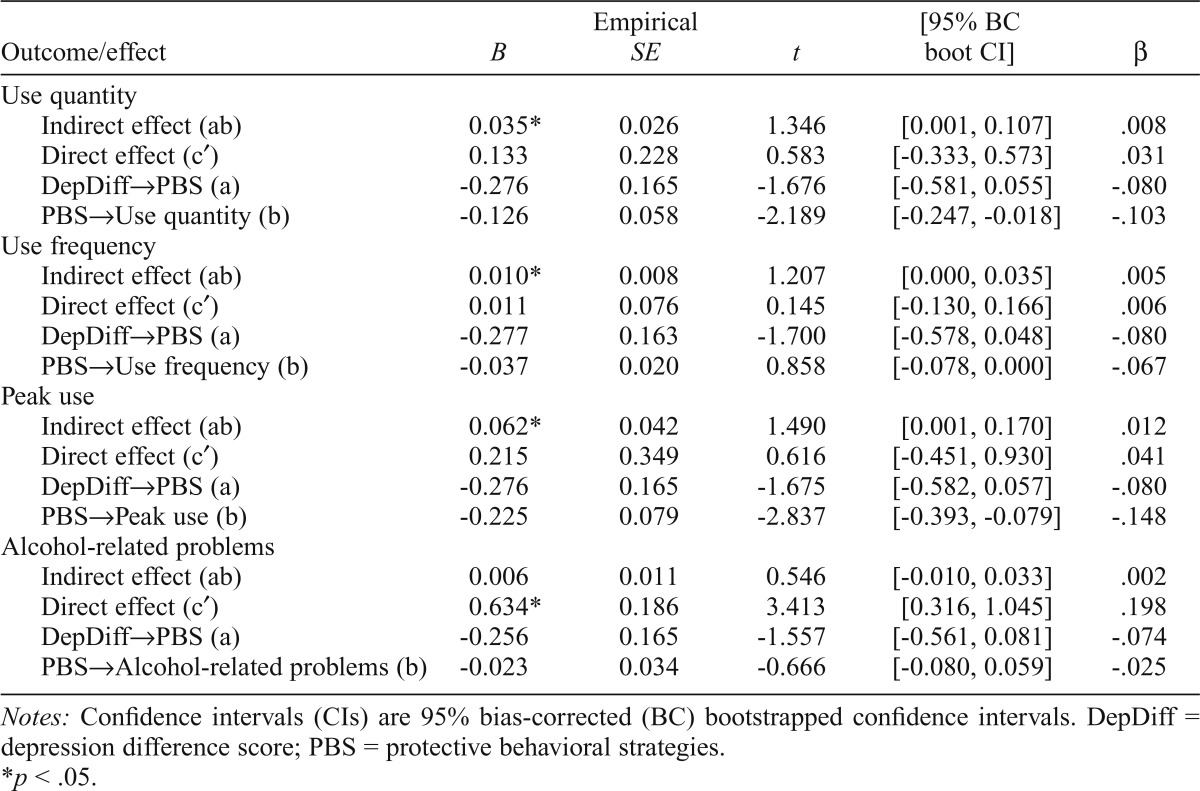
Table 2.
Summary of indirect effects

| Outcome/effect | B | Empirical SE | t | [95% BC boot CI] | β |
| Use quantity | |||||
| Indirect effect (ab) | 0.035* | 0.026 | 1.346 | [0.001, 0.107] | .008 |
| Direct effect (c′) | 0.133 | 0.228 | 0.583 | [-0.333, 0.573] | .031 |
| DepDiff→PBS (a) | -0.276 | 0.165 | -1.676 | [-0.581, 0.055] | -.080 |
| PBS→Use quantity (b) | -0.126 | 0.058 | -2.189 | [-0.247, -0.018] | -.103 |
| Use frequency | |||||
| Indirect effect (ab) | 0.010* | 0.008 | 1.207 | [0.000, 0.035] | .005 |
| Direct effect (c′) | 0.011 | 0.076 | 0.145 | [-0.130, 0.166] | .006 |
| DepDiff→PBS (a) | -0.277 | 0.163 | -1.700 | [-0.578, 0.048] | -.080 |
| PBS→Use frequency (b) | -0.037 | 0.020 | 0.858 | [-0.078, 0.000] | -.067 |
| Peak use | |||||
| Indirect effect (ab) | 0.062* | 0.042 | 1.490 | [0.001, 0.170] | .012 |
| Direct effect (c′) | 0.215 | 0.349 | 0.616 | [-0.451, 0.930] | .041 |
| DepDiff→PBS (a) | -0.276 | 0.165 | -1.675 | [-0.582, 0.057] | -.080 |
| PBS→Peak use (b) | -0.225 | 0.079 | -2.837 | [-0.393, -0.079] | -.148 |
| Alcohol-related problems | |||||
| Indirect effect (ab) | 0.006 | 0.011 | 0.546 | [-0.010, 0.033] | .002 |
| Direct effect (c′) | 0.634* | 0.186 | 3.413 | [0.316, 1.045] | .198 |
| DepDiff→PBS (a) | -0.256 | 0.165 | -1.557 | [-0.561, 0.081] | -.074 |
| PBS→Alcohol-related problems (b) | -0.023 | 0.034 | -0.666 | [-0.080, 0.059] | -.025 |
Notes: Confidence intervals (CIs) are 95% bias-corrected (BC) bootstrapped confidence intervals. DepDiff = depression difference score; PBS = protective behavioral strategies.
p < .05.
