
FIGURE 5.
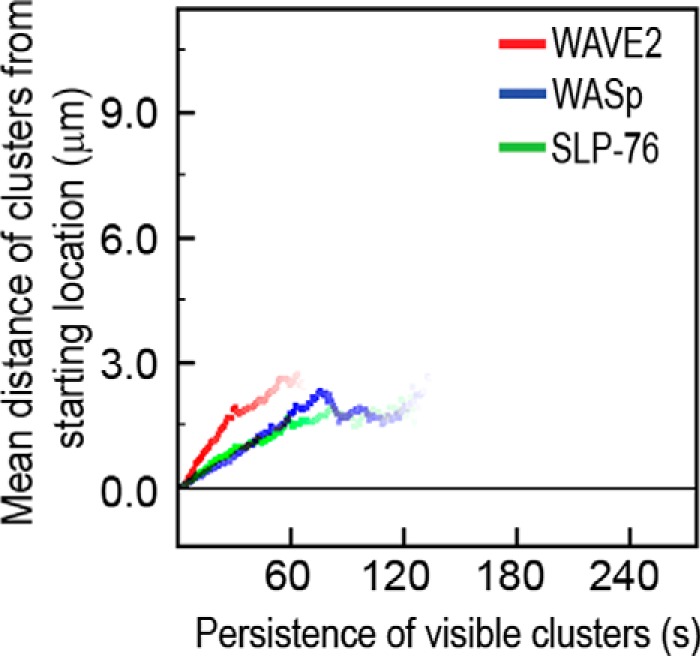
Kinetic analysis of WAVE2, WASp, and SLP-76 signaling clusters. Clusters containing fluorescently tagged WAVE2, WASp, or SLP-76 proteins were imaged and analyzed, as described under “Experimental Procedures.” Average traces demonstrating the movement of fluorescently tagged WAVE2, WASp, or SLP-76 clusters were calculated for each group. The y axis shows the average distance traversed by individual clusters (μm), the x axis is time (s), and the color intensity of the line represents the relative number of clusters that remained visible of the starting number of clusters at each time point. Ten individual clusters in each of 4–6 cells from each group were analyzed to give a total of at least 40–60 clusters from each group.