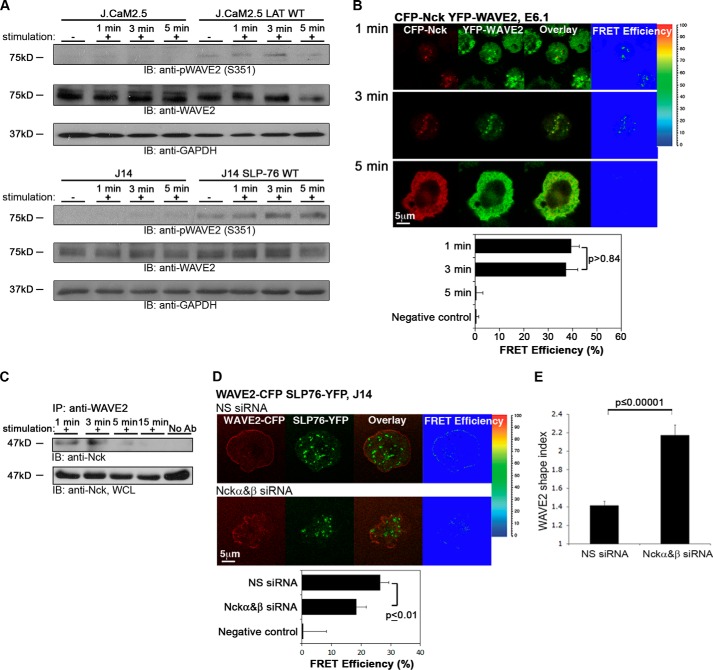
FIGURE 7.
Analysis of WAVE2 activation and molecular complex. A, LAT-deficient T cells (J.CaM2.5), J.CaM2.5 cells reconstituted with LAT WT- and SLP-76-deficient T cells (J14), and J14 cells reconstituted with SLP-76 WT were left unstimulated or stimulated for the indicated times, lysed, and blotted (IB) for pWAVE2, WAVE2, and GAPDH (as a loading control). B, FRET efficiency of the molecular interaction between Nck and WAVE2 was determined in E6.1 cells expressing CFP-Nck and YFP-WAVE2. Imaging analysis was performed on 25 cells for each time point. Data shown are representative of three independent experiments. C, Jurkat E6.1 T cells were stimulated for the indicated times and lysed. Cell lysates were immunoprecipitated (IP) with anti-WAVE2 and blotted for Nck. WCL, whole cell lysates. D, SLP-76-deficient T cells expressing SLP-76-YFP and WAVE2-CFP were treated with siRNA specific to Nckα and -β or NS siRNA. After 48 h, cells were plated and activated, and FRET efficiency for each group was calculated. E, the WAVE2 shape index was determined as described under “Experimental Procedures.” Imaging analysis was performed on 35 cells. Significant differences (p ≤ 0.00001) were found in WAVE2 distribution as determined by this assay in cells treated with Nckα and -β siRNA, compared with the results from the control group (NS). Error bars, S.E.

