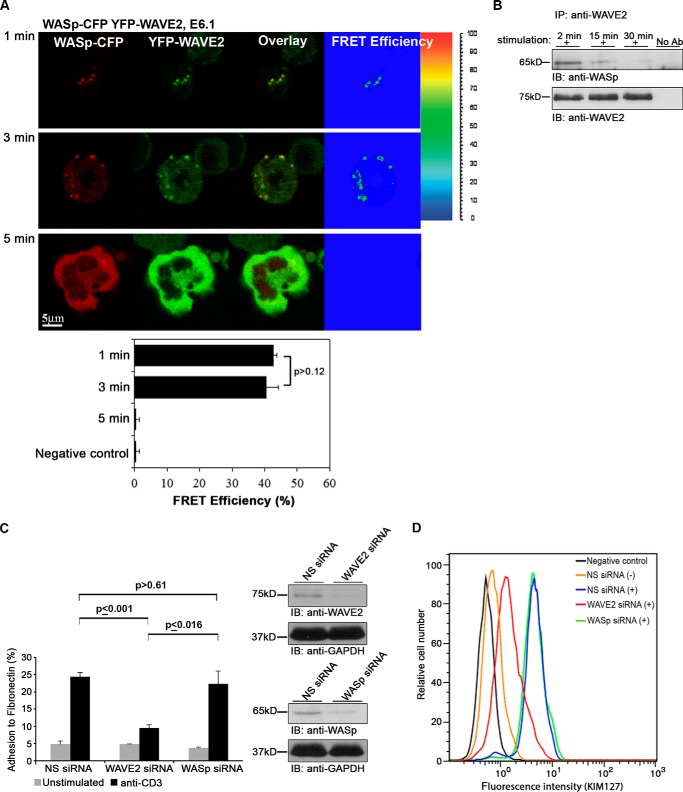
FIGURE 9.
Differential distributions and functions of WAVE2 and WASp. A, FRET analysis of the molecular interaction of WASp with WAVE2 performed in E6.1 cells expressing WASp-CFP and YFP-WAVE2. Imaging analysis was performed on 25 cells for each time point. B, PBLs were stimulated, as indicated. Cell lysates were immunoprecipitated (IP) with anti-WAVE2 antibody and immunoblotted (IB) with anti-WASp and anti-WAVE2 antibodies. C, Jurkat T cells were treated with NS siRNA, WAVE2 siRNA, or WASp siRNA. After 48 h, cells were analyzed for protein expression levels, as shown on the right. Cells were stained with calcein AM and added to a flat-bottom 96-well plate precoated with 0.3 mg of fibronectin and left unstimulated or stimulated with anti-CD3. Cell adhesion was determined as described under “Experimental Procedures.” Data shown are representative of three independent experiments. D, flow cytometry analysis of the LFA-1-active form present in cells treated with NS, WAVE2, or WASp siRNA. Flow cytometry plots were gated on total viable cells. Error bars, S.E.

