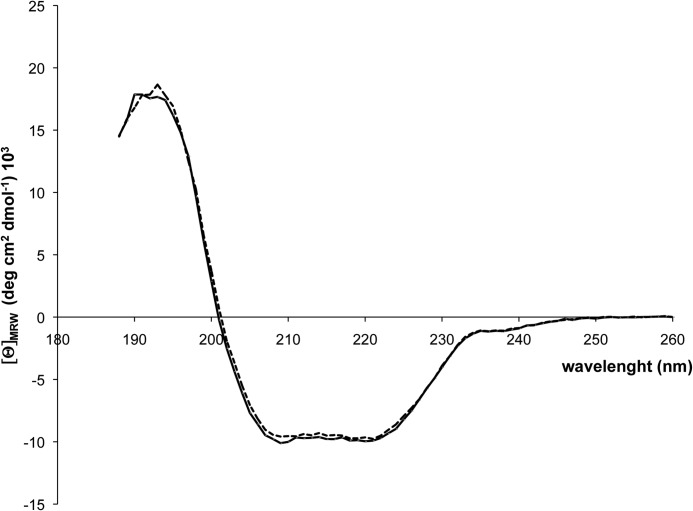
FIGURE 5.
Circular dichroism (CD) spectra of TUM1-Iso1 and TUM1-Iso2. CD spectra on TUM1-Iso1 and TUM1-Iso2 were recorded in a 1.00-mm path-length Suprasil quartz cell with a Jasco-J715 CD spectrometer equipped with a thermoelectric temperature-controlled cuvette holder. Far-UV CD was recorded in a range of 190–260 nm using a step size of 0.5 nm with a signal averaging time of 4 s at each wavelength step. 300 μl of TUM1-Iso1 (black line) and TUM1-Iso2 (dashed line) at a concentration of 0.15 mg/ml was used and normalized to the mean residue weight of each TUM1 isoform.

