FIGURE 2.
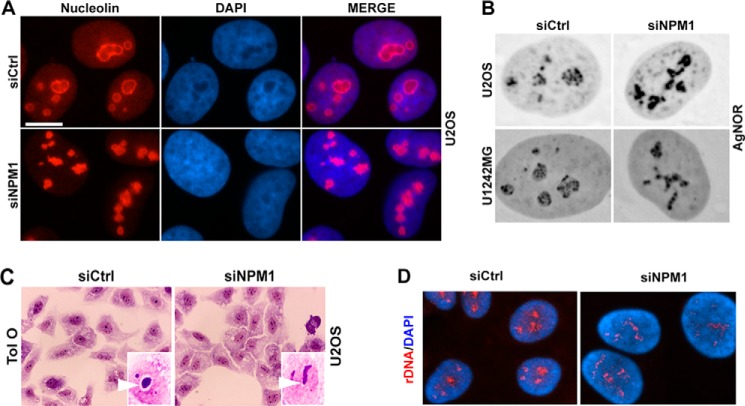
Changes in Ag-NOR staining patterns and altered localization of rDNA in NPM1-depleted cells. A, nucleolin immunolocalization (red) in NPM1-depleted and control U2OS cells. Scale bar: 10 μm. B, representative micrographs of Ag-NOR-stained NPM1-depleted U2OS and U1242MG cells. Magnification, ×40. C, Toluidine blue O staining of U2OS cells depleted of NPM1 versus siCtrl. Insets illustrate the perinucleolar white halo in siCtrl cells, lost in siNPM1-treated cells. Magnification, ×40. D, rDNA localization in cells depleted of NPM1. Interphase U2OS cells were subjected to fluorescent in situ hybridization to visualize the localization of the rDNA. The rDNA was hybridized to a probe specific for the NOR region (red), and nuclei were stained with DAPI (blue).

