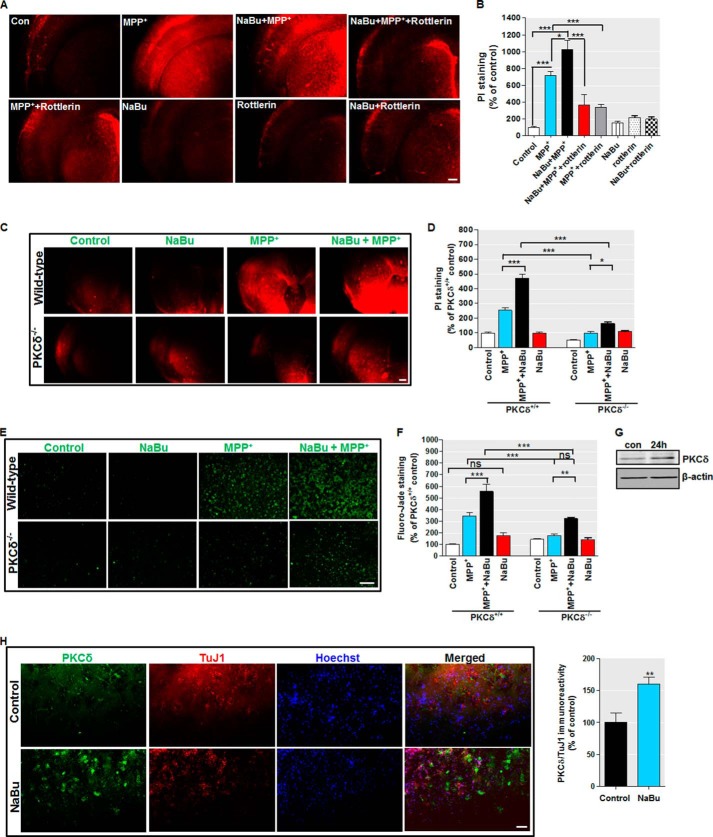
FIGURE 13.
Increased PKCδ sensitizes organotypic corticostriatal slice cultures to MPP+-induced neurodegeneration. A, organotypic corticostriatal slice cultures from wild-type adult C57 black mice were preincubated in the presence or absence of 1 mm NaBu and/or 5 μm rottlerin for 3 h followed by a 24-h incubation with 300 μm MPP+. Cell death was measured using PI uptake assay. Representative PI uptake fluorescent images are shown. Images were obtained using a Nikon TE2000 fluorescence microscope. Magnification, ×2. Scale bar, 500 μm. B, quantification of PI fluorescence intensity. PI fluorescence was measured in each group using ImageJ software. C, organotypic corticostriatal slice cultures from wild-type and PKCδ knock-out (PKCδ−/−) C57 black mice were pretreated with or without 1 mm NaBu for 3 h and then cotreated with 300 μm MPP+ for 24 h, and cell death was measured using PI uptake assay. Representative PI uptake fluorescent images are shown. Magnification, ×2. Scale bar, 500 μm. D, quantification of PI fluorescence intensity. E, organotypic corticostriatal slice cultures from 9- to 12-day-old wild-type and PKCδ−/− pups were pretreated with or without 1 mm NaBu for 3 h and then cotreated with 300 μm MPP+ for 24 h, and cell death was measured using Fluoro-Jade staining assay. Representative Fluoro-Jade fluorescent images are shown. Magnification, ×20. Scale bar, 100 μm. F, quantification of Fluoro-Jade fluorescence intensity. G, organotypic corticostriatal slice cultures from adult C57 black mice were treated with 1 mm NaBu for 24 h, and levels of PKCδ were analyzed by immunoblot. H, exposure of organotypic corticostriatal slices to 1 mm NaBu increased PKCδ immunoreactivity. After treatment, cultures were immunostained for PKCδ (green) and neuron-specific marker β-III tubulin (red), and the nuclei were counterstained by Hoechst 33342 (blue). Images were taken using a Nikon TE2000 fluorescence microscope. Magnification, ×20. Scale bar, 50 μm. Representative immunofluorescence images are shown. Quantification of normalized PKCδ (PKCδ/TuJ1) immunoreactivity is shown in the right panel. Fluorescence immunoreactivity of PKCδ and TuJ1 was measured in each group using ImageJ software. All data expressed as percent of wild-type control (con) group are mean ± S.E. and representative for results obtained from three separate experiments. ns, not significant. *, p < 0.05; **, p < 0.01; ***, p < 0.001.

