FIGURE 2.
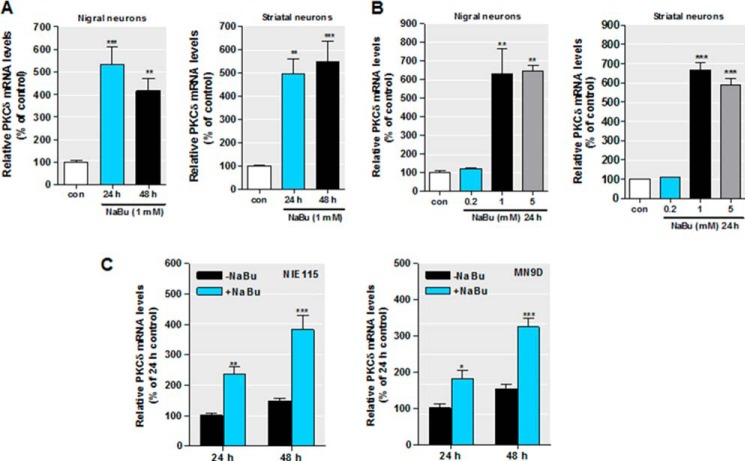
HDAC inhibition increases PKCδ mRNA expression. A–B, primary mouse nigral (left panel) and striatal (right panel) neurons were exposed to 1 mm NaBu for 24 or 48 h (A) or to different concentrations of NaBu for 48 h (B). Real time RT-PCR analysis of PKCδ mRNA level was performed. β-Actin mRNA level served as internal control. C, NIE115 (left panel) and MN9D (right panel) cells were exposed to 1 mm NaBu for 24 or 48 h, and PKCδ mRNA expression was evaluated by real time RT-PCR analysis. β-Actin mRNA level served as internal control. All values are expressed as a percentage of the activity of controls and represented as means ± S.E. of three independent experiments performed in triplicate. *, p < 0.05; **, p < 0.01; ***, p < 0.001; control (con) versus butyrate-treated samples.

