FIGURE 8.
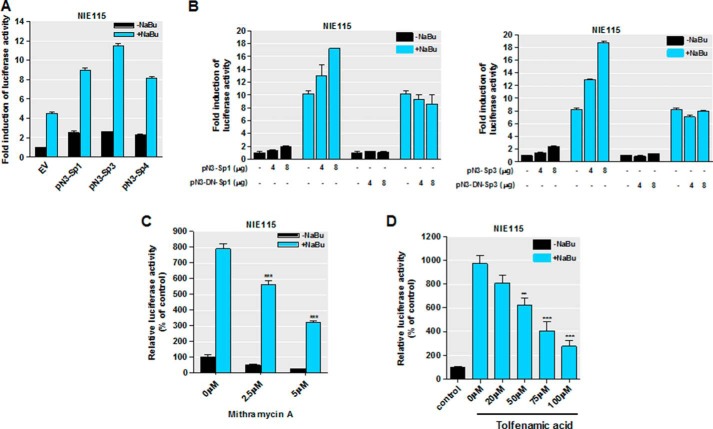
Sp family transcriptional factors mediate responsiveness to sodium butyrate. A, overexpression of Sp1, Sp3, and Sp4 synergistically activated the NaBu induction of PKCδ promoter activity in NIE115 cells. NIE115 cells were cotransfected with pGL3−147/+289 and 8 μg of pN3-Sp1, pN3-Sp3, pN3-Sp4, or empty vector (EV) pN3. After 24 h of transfection, the cells were incubated with or without 1 mm NaBu for 24 h. Luciferase activities were then assayed and normalized by total cellular protein. Luciferase activity following transfection of empty vector without NaBu treatment was assigned the value 1, and all other data are expressed as a fold induction thereof. The results are represented as means ± S.E. of three independent experiments performed in triplicate. B, overexpression of the dominant-negative mutant Sp1 or Sp3 protein (left panel, pN3-DN-Sp1; right panel, pN3-DN-Sp3) lacking the transactivation domains did not enhance the NaBu induction of PKCδ promoter activity in NIE115 cells. NIE115 cells were cotransfected with pGL3−147/+289 and varying concentrations (4–8 μg) of pN3-Sp1, pN3-DN-Sp1, pN3-Sp3, or pN3-DN-Sp3 for 24 h. Cells were then exposed to 1 mm NaBu for 24 h, and luciferase activities were determined and normalized. The results are represented as means ± S.E. of three independent experiments performed in triplicate. Variations in total DNA were compensated with the corresponding empty vector pN3. C and D, mithramycin A (C) and tolfenamic acid (D) inhibited the response to NaBu. NIE115 cells were transfected with the PKCδ promoter reporter construct pGL3−147/+289 for 24 h. After pretreatment with different doses of mithramycin A and tolfenamic acid for 1 h, the cells were incubated with or without NaBu (1 mm) for 24 h. Cells were then harvested, and luciferase activities were determined and normalized by total cellular protein. Values are expressed as a percentage of the activity obtained from control samples without NaBu and mithramycin A or tolfenamic acid treatment and are represented as means ± S.E. of three independent experiments performed in triplicate. **, p < 0.01; ***, p < 0.001; mithramycin A or tolfenamic acid-treated versus untreated samples.

