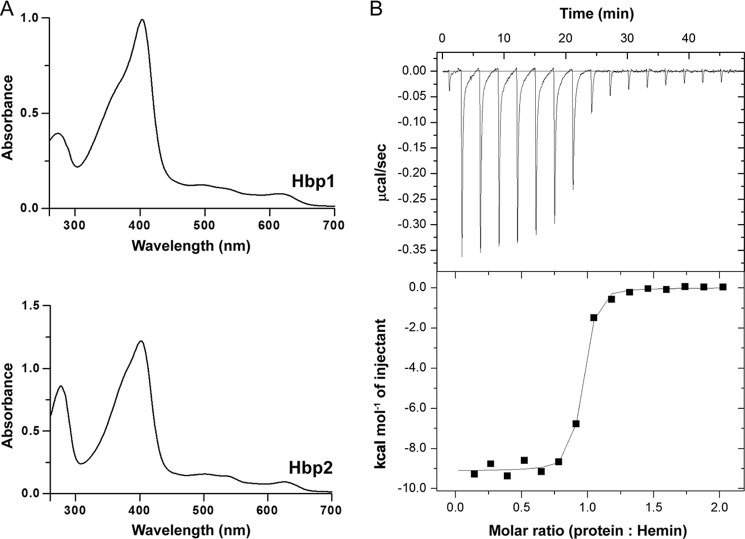
FIGURE 2.
UV-visible spectra of Hbp1 and Hbp2. A, hemin added to a final concentration of 10 μm to 10 μm Hbp1 or Hbp2. B, representative ITC data for Hbp2N3. Fresh hemin was injected stepwise into a cell containing apoprotein at a constant temperature of 25 °C. The top panel shows the time course of the titration (black) and baseline (gray). The bottom panel shows the integrated isotherms. The program ORIGIN was used to fit the data using non-linear regression to a one-site binding model to derive thermodynamic parameters.

