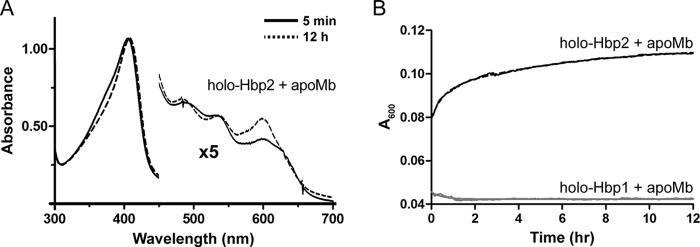
FIGURE 4.

Hemin dissociation from Hbp1 and Hbp2. H64Y/V68F apomyoglobin was added at a final concentration of 50 μm to 5 μm Hbp1 or Hbp2. A, the absorbance spectra for reactions at 5 min and 12 h for Hbp2 are shown as solid and dotted lines, respectively. B, the panel shows the absorbance change at 600 nm, which is indicative of hemin scavenging by the H64Y/V68F myoglobin. For Hbp2, the black dotted line represents the raw data, and the solid line is the best fit using a double exponential function. The data for Hbp1 are shown in gray and could not be reliably fit because very little or no hemin is released from this protein.
