FIGURE 7.
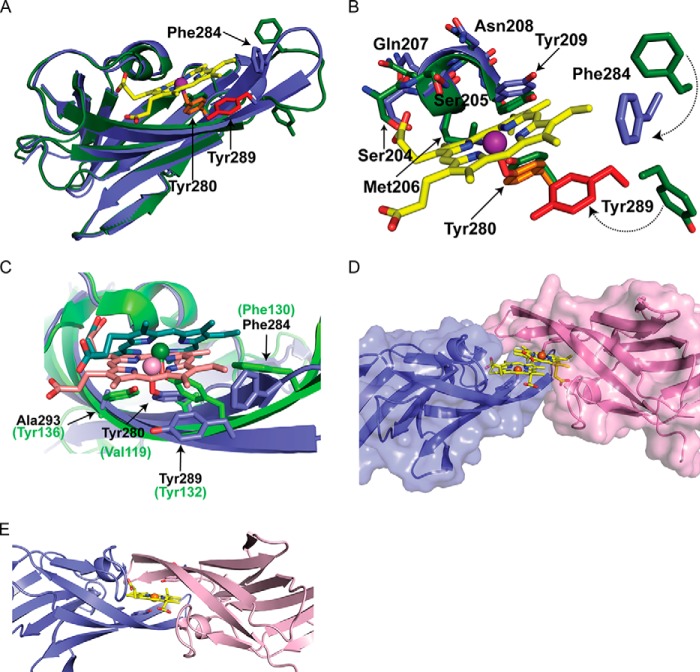
Superimposition of apo- and holo-Hbp2N2. A, ribbon representation of superimposition of apo- (green) and holo-Hbp2N2 (blue). Residues shown as sticks are color-coded for holo-Hbp2N2 to match those in Fig. 6. B, superimposition of the hemin binding pocket. C, superimposition of holo-Hbp2N2 and S. aureus IsdC in blue and green, respectively. The hemes bound to holo-Hbp2N2 and IsdC are shown in stick format in pink and green, respectively. Iron atoms are shown as spheres. The residues corresponding to holo-Hbp2N2 and IsdC are shown in black and green, respectively. D, holo-Hbp2N2 shown as a surface representation. E, a model of the possible transfer complex formed by two molecules of Hbp2N2 generated by superimposing chains A and B via their heme molecules that was then energy-minimized with Rosetta and the Crystallography and NMR System (CNS) software suite.

