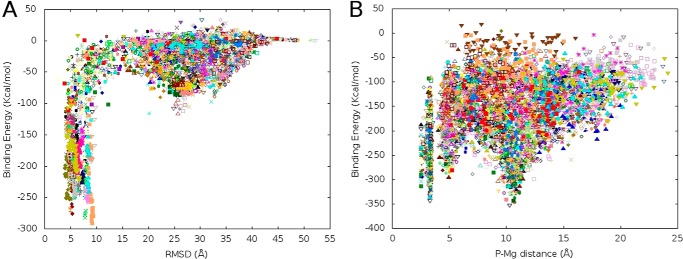
FIGURE 1.

Ligand binding energy profiles computed by PELE. A, binding energy profile in the full surface exploration against the ligand r.m.s.d. (heavy atom r.m.s.d.) to the bound reference structure. B, binding energy profile against the P-Mg distance along the ligand refinement process in the active site. In both panels, each dot corresponds to a binding energy (see “Experimental Procedures”) obtained from a protein-ligand complex obtained in PELE sampling. Different colors correspond to processors.
