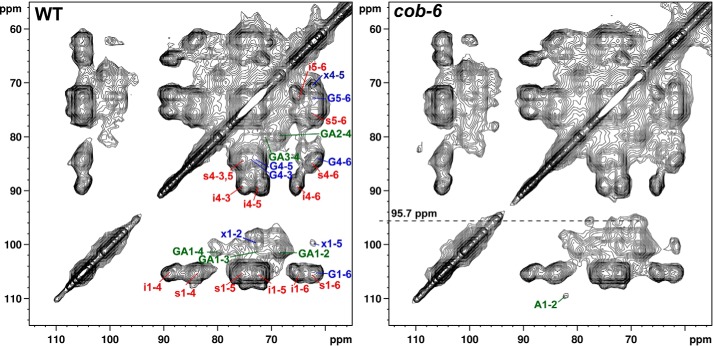
FIGURE 6.
13C-13C chemical shift correlation spectra of WT and cob-6 acquired with 50-ms dipolar-assisted rotational resonance mixing time. The spectra from Fig. 4 was plotted at lower contour levels, emphasizing the cross-section at ∼96 ppm in the cob-6 spectrum. The cross-section signals have been assigned to the β-glucose reducing end units, which can be detected when the degree of polymerization of cellulose is sufficiently low.

