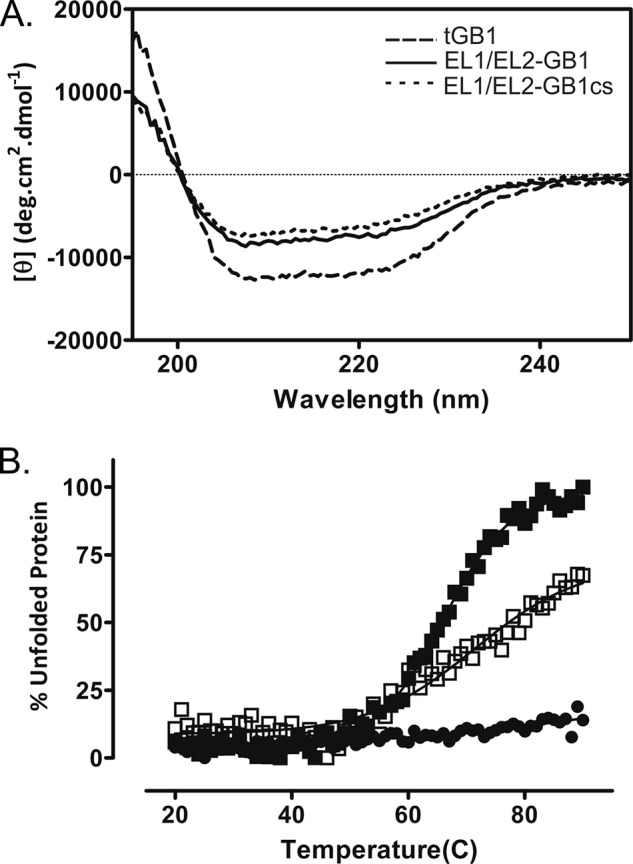
FIGURE 2.

A, CD spectra of EL1/EL2-GB1 (solid line) and EL1/EL2-GB1cs (dotted line) exhibit less secondary structure compared with tGB1 (dashed line), which is consistent with the addition of unstructured loops. B, protein unfolding was measured by CD measurement at 222 nm at temperatures ranging from 20 to 90 °C. The control tGB1 (■) did not unfold over this temperature range; however, EL1/EL2-GB1 (●) and EL1/EL2-GB1cs (○) unfolded with Tm values of 65 °C and >70 °C, respectively.
