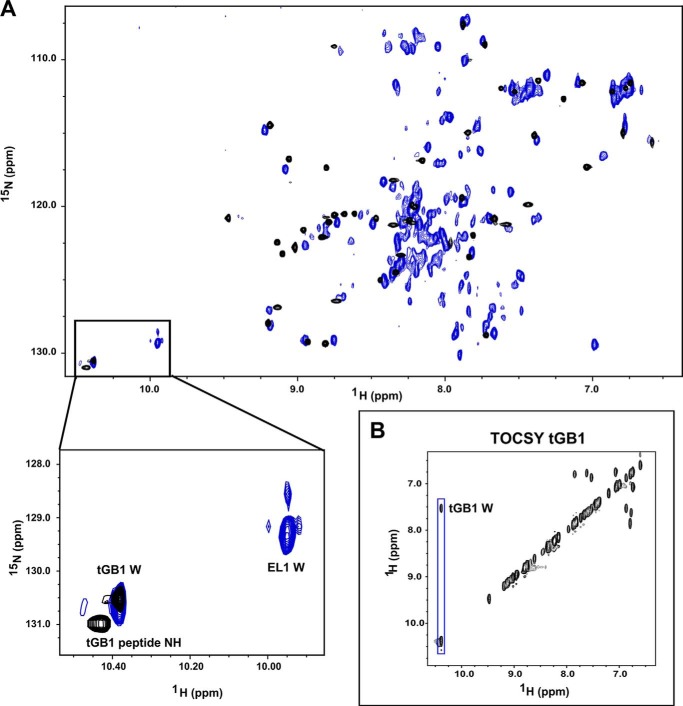
FIGURE 4.
15N HSQC spectra of tGB1 (black) overlaid with EL1/EL2-GB1 (blue). A, the spectra show that the majority of dispersed peaks are most likely residues of the tGB1 scaffold with obvious glycine peptide and the tryptophan side chain resonances visibly unique to EL1/EL2-GB1. The inset highlights the tGB1 and EL1 tryptophan side chain resonances. B, TOCSY of tGB1 confirmed the identity of tGB1 tryptophan in the spectra. The additional resonance near 10.4 ppm (1H) and 131 ppm (15N) in the tGB1 spectra belongs to a peptide group. Experiments were conducted on protein at 150 μm in 50 mm phosphate buffer, pH 6.8, at 40 °C.

