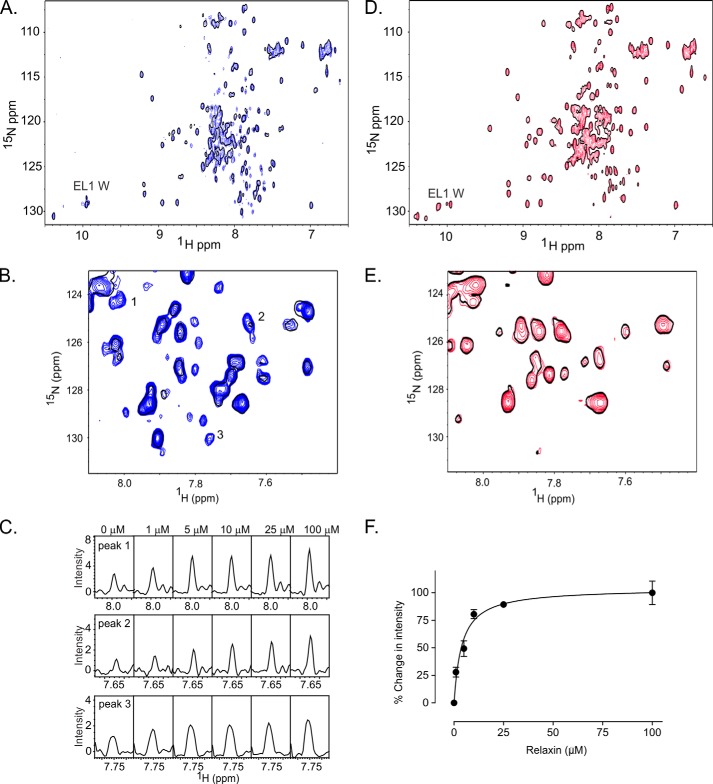
FIGURE 5.
15N HSQC spectrum demonstrating H2 relaxin interacts with of EL1/EL2-GB1 and not EL1/EL2-GB1cs. The data were acquired in 50 mm NaH2PO4, pH 6.8, at 40 °C. A, overlay of the 15N HSQC spectra of EL1/EL2-GB1 with 0 (single black contour) and 10 μm H2 relaxin (blue contours) demonstrating resonances appearing and increasing in intensity upon the addition of H2 relaxin. B, expansion of a region of the overlay of EL1/EL2-GB1 at 0 and 10 μm H2 relaxin. C, resonances numbered in B are shown in cross-section at 0, 1, 5, 10, 50, and 100 μm H2 relaxin, demonstrating the dose dependence of the intensity changes. D, overlay of the 15N HSQC spectra of EL1/EL2-GB1cs with 0 (single black contour) and 10 μm H2 relaxin (red contours). E, expansion of a region of the overlay of EL1/EL2-GB1cs at 0 and 10 μm H2 relaxin showing no dose dependence changes to the spectra. F, the average change in intensity of 20 15N HSQC peaks for EL1/EL2-GB1 with the addition of H2 relaxin (Kd of 3.9 ± 0.9 μm). No peaks from EL1/EL2-GB1cs were able to exhibit the same response, indicating no interaction between EL1/EL2-GB1cs and H2 relaxin, confirming the results from the pulldown assay.

