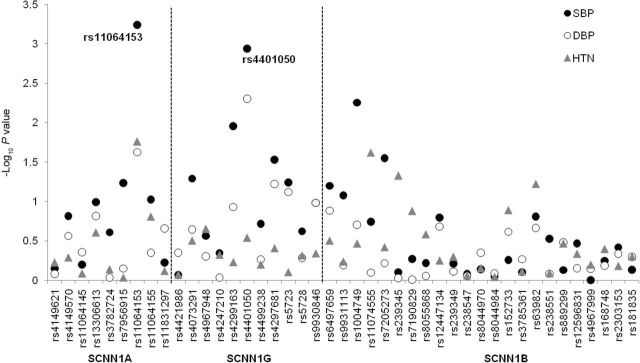
Figure 1.

–Log10 P values for the 43 single nucleotide polymorphisms (SNPs) in SCNN1A, SCNN1G, and SCNN1B with longitudinal changes in systolic blood pressure (SBP), diastolic blood pressure (DBP), and hypertension (HTN) incidence. The black and white circles indicate P values for the testing of genotype by follow-up time interactions for SBP and DBP, respectively. The gray triangles indicate P values for the testing of the SNP effect on hypertension incidence. Two labeled SNPs were significantly associated with longitudinal changes in SBP after Bonferroni correction for multiple testing (α threshold = 0.05/43 = 0.001).
