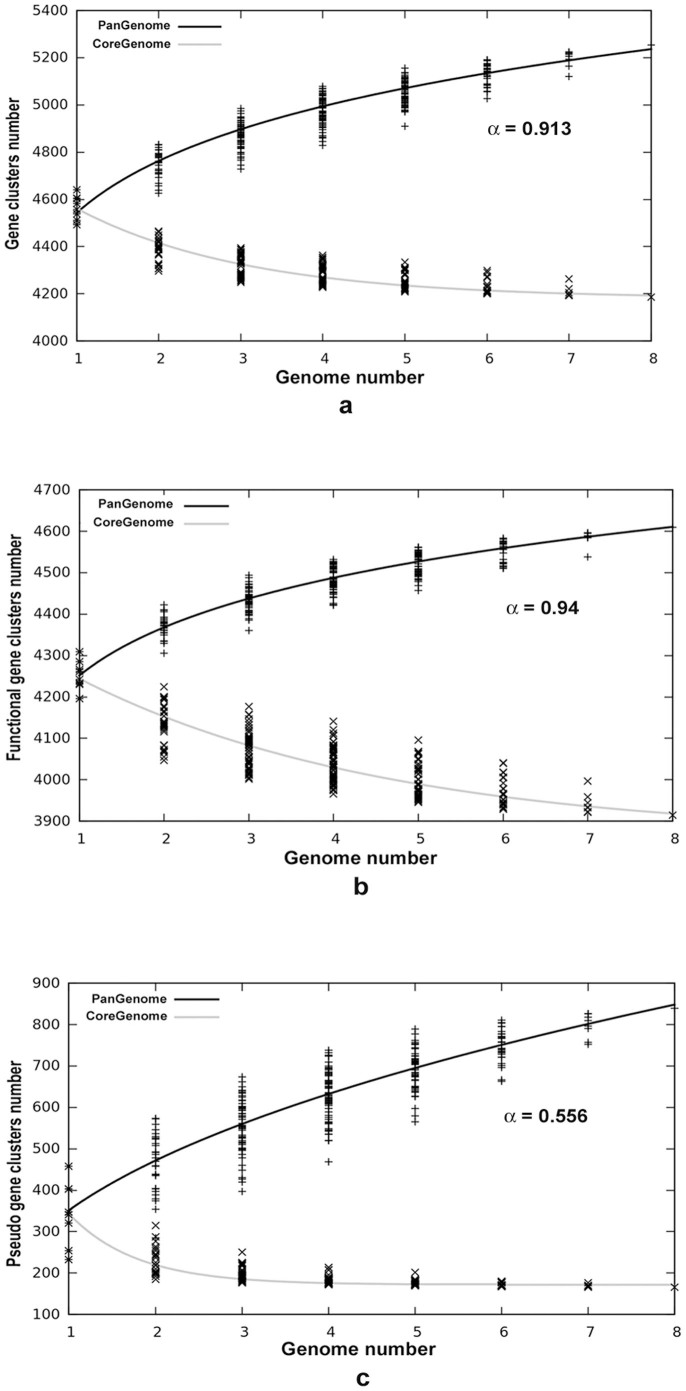
Figure 3. Pan and Core Genome Distribution.
(a). Pan and core genome developments using median values of the combinations of all eight genomes. (b). Pan and core genome developments of functional genes of these eight isolates. Here it can be observed that core genome is decreasing sharply. (c). Pan and core genome developments of pseudogenes of these eight isolates. It can be seen that pan genome of pseudogenes is highly non conservative with a steep increase in accessory content while the core genome reached convergence.

