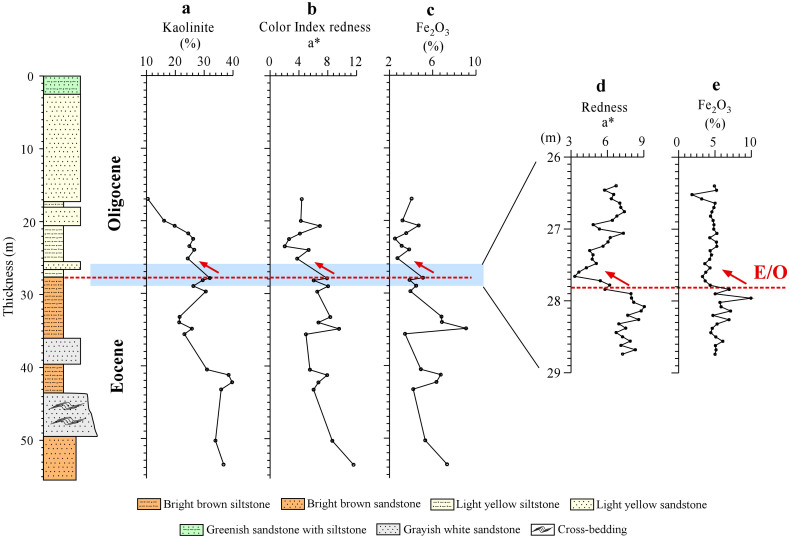
Figure 4. Paleoclimatic changes indicated by various climatic proxies.
(a), Variations of kaolinite versus depth. (b), Vertical fluctuations of color index of redness (a*). (c), Variations of Fe2O3 content of the Keziletuogayi section. (d) and (e), High-resolution curves of the redness (a*) and the Fe2O3 content across the Eocene–Oligocene Boundary. Red arrow indicates the variation trend at the Eocene–Oligocene Boundary.

