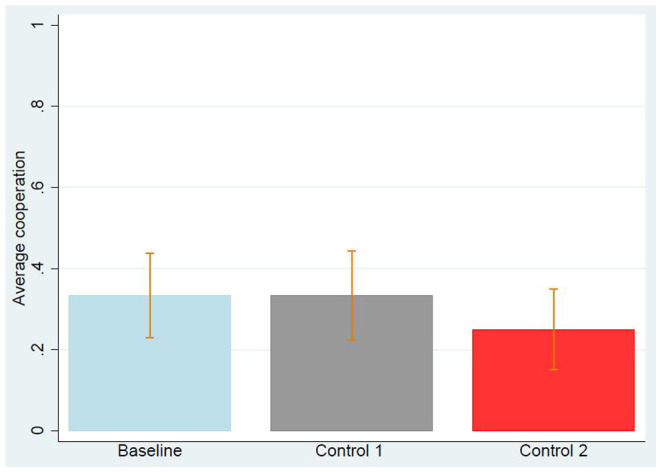
Figure 1. Average cooperation in Study 1 for each of the three treatments, using DataSet.

Error bars represent the standard error of the mean. It is visually clear that the control treatments do not significantly differ from the baseline. Logistic regression confirms this expectation, as reported in Table 1.
