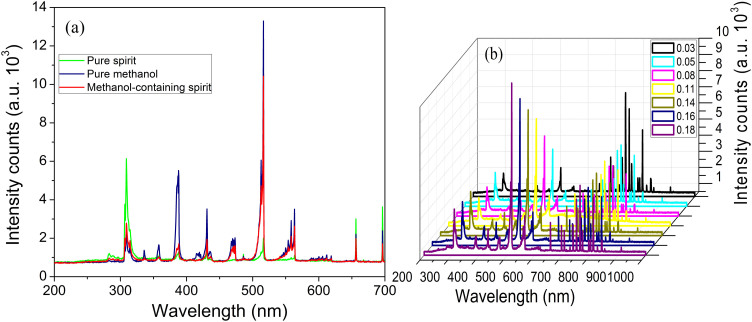
Figure 5. Comparison of the emission of spirit, methanol and methanol-containing spirit.
(a) Emission spectra obtained in the presence of pure spirit (green line), pure methanol (blue line), and methanol-containing spirit (red line). (b) OES emission intensity versus the standard samples with varieties of methanol concentrations. The applied power is about 5 W.

