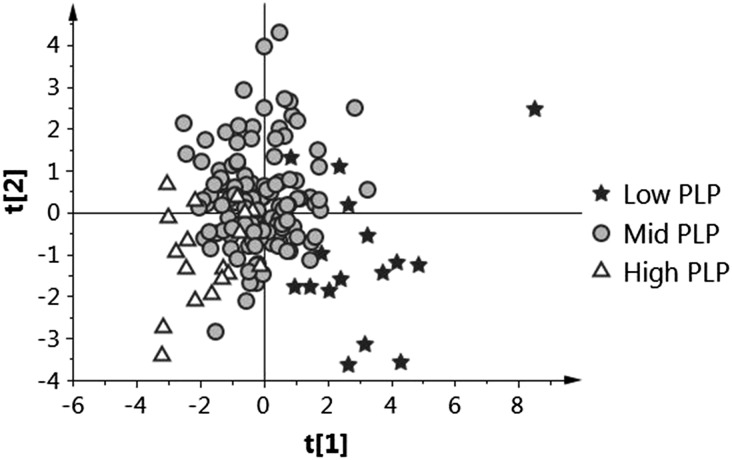
FIGURE 3.
Score plot from partial least squares–discriminant analysis of overall data for one-carbon, tryptophan metabolites, ratios, and biomarkers of inflammation in OC users according to PLP concentrations. Low PLP: ≤30 nmol/L; mid PLP: 31–99 nmol/L; high PLP: ≥100 nmol/L. Each data point represents a function of a pooled metabolite profile of each participant. Pyridoxal, 4-pyridoxic acid, and pyridoxine were omitted for this analysis to focus the analysis on the non–vitamin B-6 patterns of metabolites. Cumulative R2Y values for components 1 and 2 were 0.187 and 0.292, respectively. OC, oral contraceptive; PLP, pyridoxal 5′-phosphate; R2Y, variation of all Y explained by the model.

