
Figure 5.
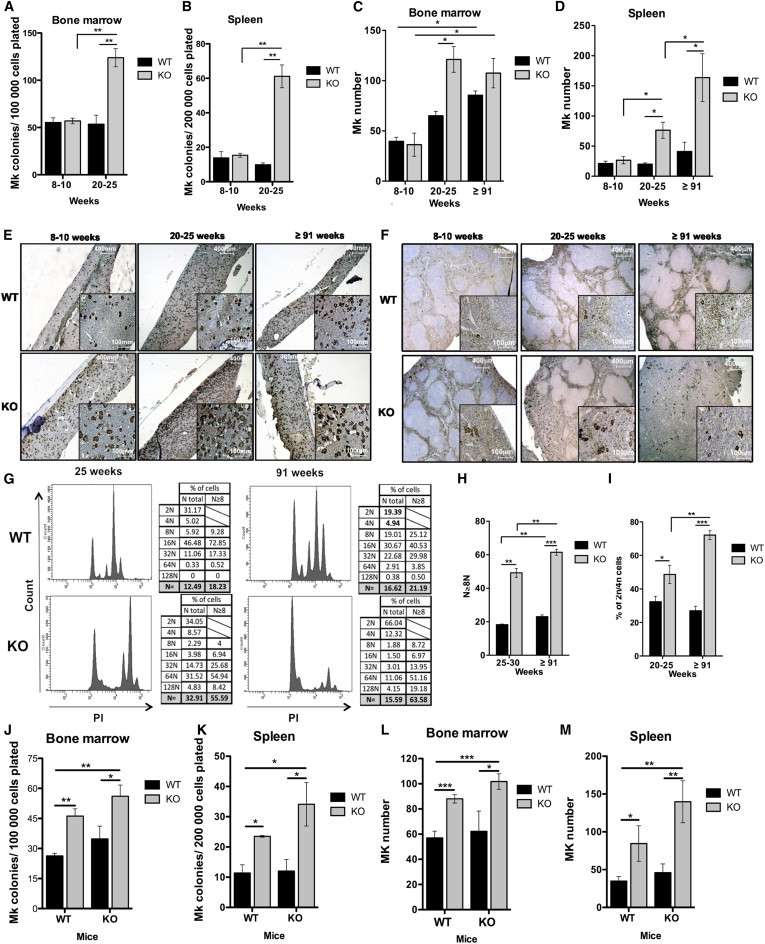
Absence of p19INK4d Leads to a Progressive Age-Dependent Increase in the Number of MKs in BM and Spleen of Mice
(A and B) Number of MK-Ps derived from total BM cells (A) and total spleen cells (B) of 8- to 10-week-old (n = 3) and 20- to 25-week-old (n = 4) mice cultured in fibrin clots. Experiments were performed in triplicate for each biological replicate.
(C–F) Counts of MKs identified by vWF staining in BM (C) and spleen (D) of 8- to 10-week-old (n = 3), 20- to 25-week-old (n = 4) and in >91-week-old (n = 6) mice. The number of MKs was determined on equal areas of three independent image frames for each mouse. Representative pictures are shown for BM (E) and spleen (F).
(G) Cell cycle was measured by PI staining (middle panel) within the MK (CD41+) population (left panel). Total and ≥8N MK ploidy level (right panel) was calculated for 20- to 25-week-old and >91-week-old mice.
(H) Mean ploidy level calculated for ≥8N MK.
(I) Percentage of 2N/4N MK cells in BM of 20- to 25-week-old and >91-week-old mice. Data represent mean ± SEM (n = 4) for 20- to 25-week-old and (n = 3) for >91-week-old mice.
(J and K) Number of MK-P derived from total BM cells (J) and total spleen cells (K) in 8-month-old transplanted WT and KO mice cultured in fibrin clots. Experiments were performed in triplicate for each biological replicate.
(L and M) Counts of MKs identified by vWF staining in BM (L) and spleen (M) in 8-month-old transplanted WT and KO mice (n = 5). The MK number was determined on equal areas of three independent image frames for each mouse.
KO, p19INK4d−/−. Data represent mean ± SEM. ∗p < 0.05, ∗∗p < 0.01, ∗∗∗p < 0.001, unpaired t test. See also Figure S3.