
Figure 5.
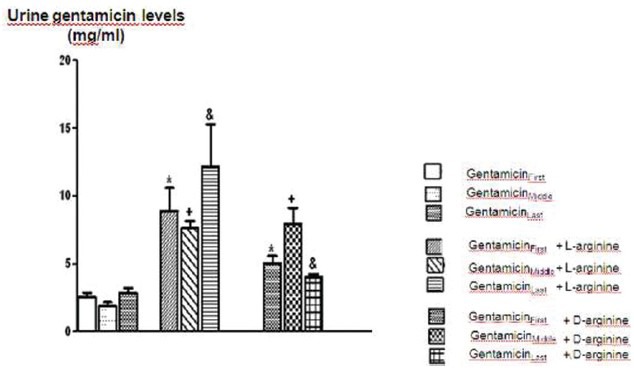
The comparison of urine gentamicin levels of Gentamicin, Gentamicin+L-arginine and Gentamicin+D-arginine applied groups. Data are expressed as means ± S.E.M. for the groups; n = 7 in each group. Statistical analysis was performed by one-way analysis of variance (ANOVA) and comparison of groups were performed using Bonferroni test. *(P < 0.05) vs gentamicin first group, +(P < 0.05) vs gentamicin in middle, and (P < 0.05) vs gentamicin in last group