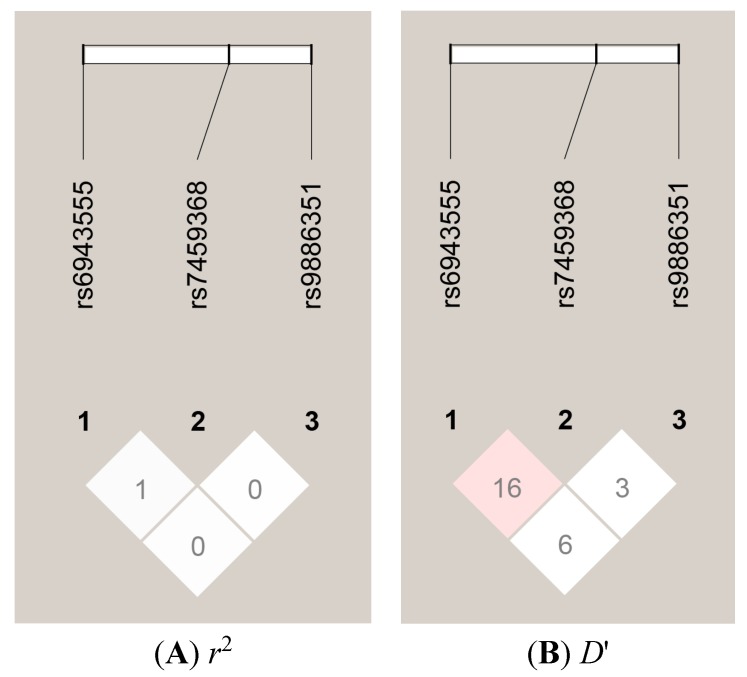
Figure 1.
Linkage disequilibrium (LD) plots of the three single-nucleotide polymorphisms (SNPs) of the autism susceptibility candidate 2 (AUTS2) gene. The values in the squares are the pair-wise calculations of r2 (A) or D' (B). The white squares with the “0” indicate r2 = 0 (i.e., No LD between a pair of SNPs). The white squares with the “16” indicate D' = 0.16 (i.e., very low LD between a pair of SNPs).

