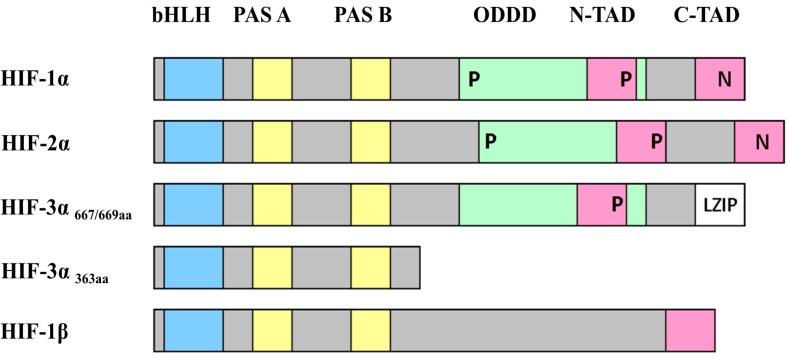
Figure 2.
A schematic representation of the domain structures of the HIFs. The figure shows the structural motifs basic-Helix-Loop-Helix (bHLH, in blue), PER/ARNT/SIM (PAS, in yellow), the oxygen-dependent degradation domain (ODDD, in green and also spanning the N-TAD region), the N-terminal and C-terminal transactivation domains (N-TAD and C-TAD, in pink), and the leucine zipper (LZIP, in white). The positions of the prolines hydroxylated by PHDs (prolyl-hydroxylase domain containing enzymes) are indicated by P and the asparagines hydroxylated by FIH (factor inhibiting HIF) are indicated by N. Adapted from [47].

