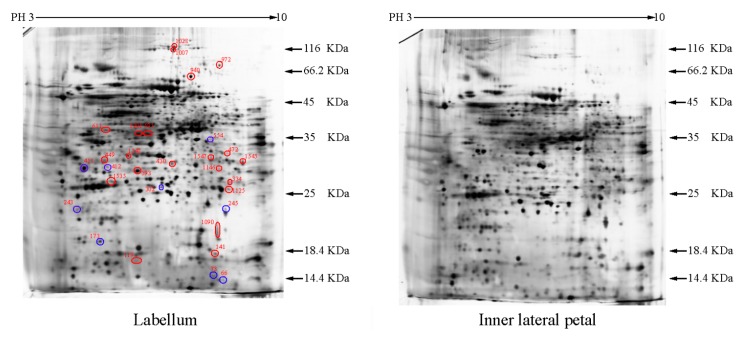
Figure 1.
Protein expression profiles for labellum and inner lateral petal. Proteins were separated in the first dimension by isoelectric focusing (pH 3–10), in the second dimension by SDS-PAGE in 12.5% (w/v) polyacrylamide gels, and then silver stained. Proteins that were up regulated (red circles) or down regulated (blue circles) in labellum.

