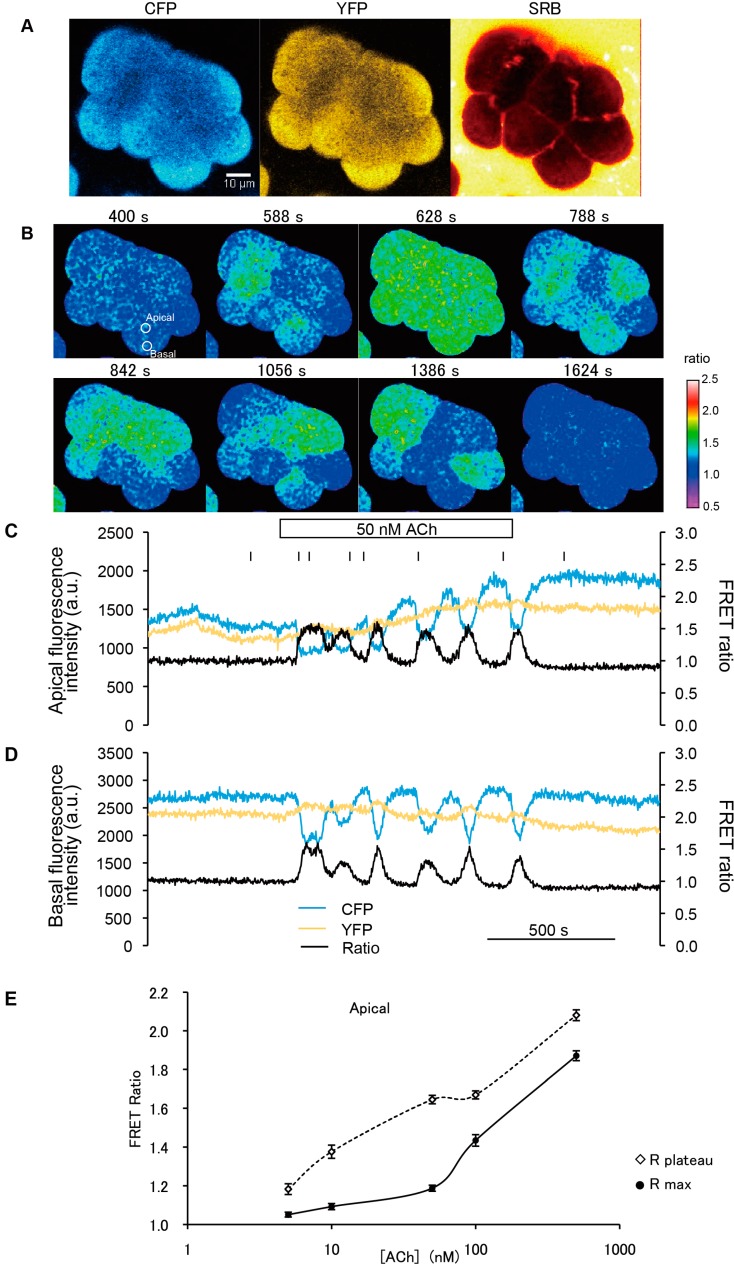
Figure 3.
Acetylcholine (Ach)-induced Ca2+ oscillations revealed by FRET signals in two-photon excitation fluorescence images. (A) Two-photon excitation fluorescence images of CFP (left) and YFP (middle), and cross-section image in SRB solution to monitor exocytotic events (right), before stimulation (−144 s; time origin is the time at which the agonist was applied); (B) FRET images showing repeated Ca2+ waves from the apical to basal regions during 50 nM ACh stimulation; (C,D) Time course of changes in CFP, YFP signals, and FRET ratio in apical (C) and basal (D) regions in a cell. Regions correspond to the “apical” and “basal” circles in (B). Stimulation with a physiological agonist concentration of 50 nM ACh induced repeated unidirectional Ca2+ oscillations. After the agonist was washed out, the value of the FRET ratio returned to the initial level; and (E) Dose dependency of the FRET ratio on ACh concentration. In the apical region of acinar cells, the maximum peak of the FRET ratio increases as a function of acetylcholine concentration (white diamonds). FRET ratio values in sustained plateau during stimulation were plotted against the ACh concentration (black dots), although in some cases no plateau was observed (e.g., C and D, stimulated with 50 nM ACh). In those cases, FRET ratio values at the bottom of the oscillation curve were measured and plotted instead. Error bars represent S.E. The number of cells measured (n) at each concentration was as follows: 6 (5 nM), 17 (10 nM), 7 (50 nM), 8 (100 nM), and 10 (500 nM).

