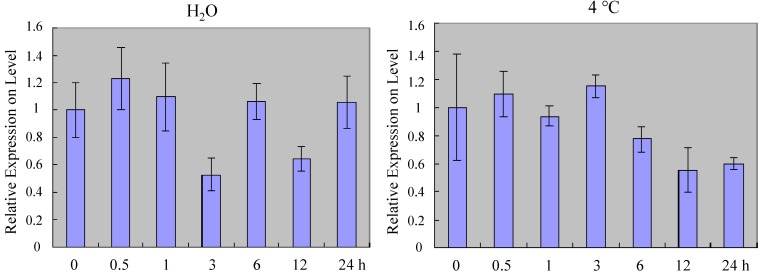
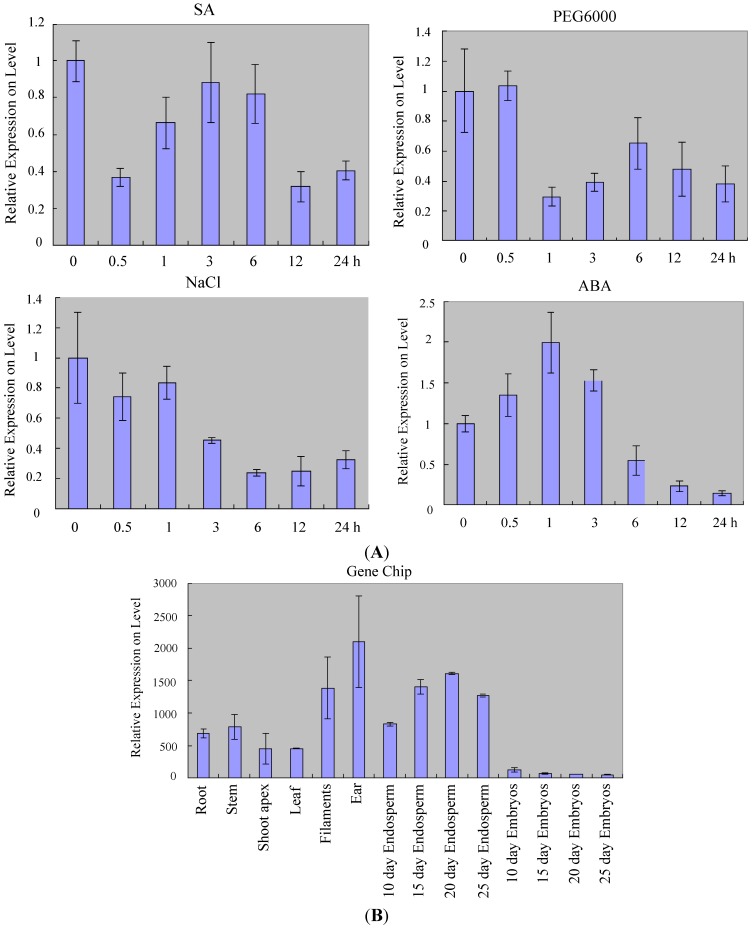
Figure 2.
Expression profiles of ZmSOC1. (A) ZmSOC1 expression under stress conditions. ZmSOC1 expression was analyzed using qRT-PCR in Z31 leaves under different stress treatments (i.e., NaCl (250 mM), PEG6000 (20%), Abscisic Acid (ABA, 100 µM), Salicylic acid (SA, 100 µM), 4 °C, and H2O without nutrients) for different period of time (0, 0.5, 1, 3, 6, 12 and 24 h); (B) ZmSOC1 expression levels in maize tissues. The standardized data from the GeneChip of maize were used for the expression analysis; the data of eight tissues were extracted from root, stem, leaf, shoot apex, filament, ear, embryo and the endosperm compartment.


