Figure 1.
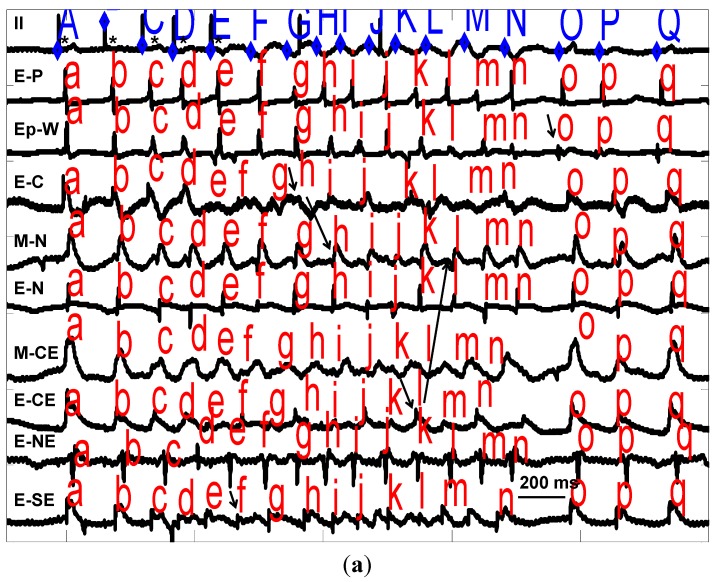
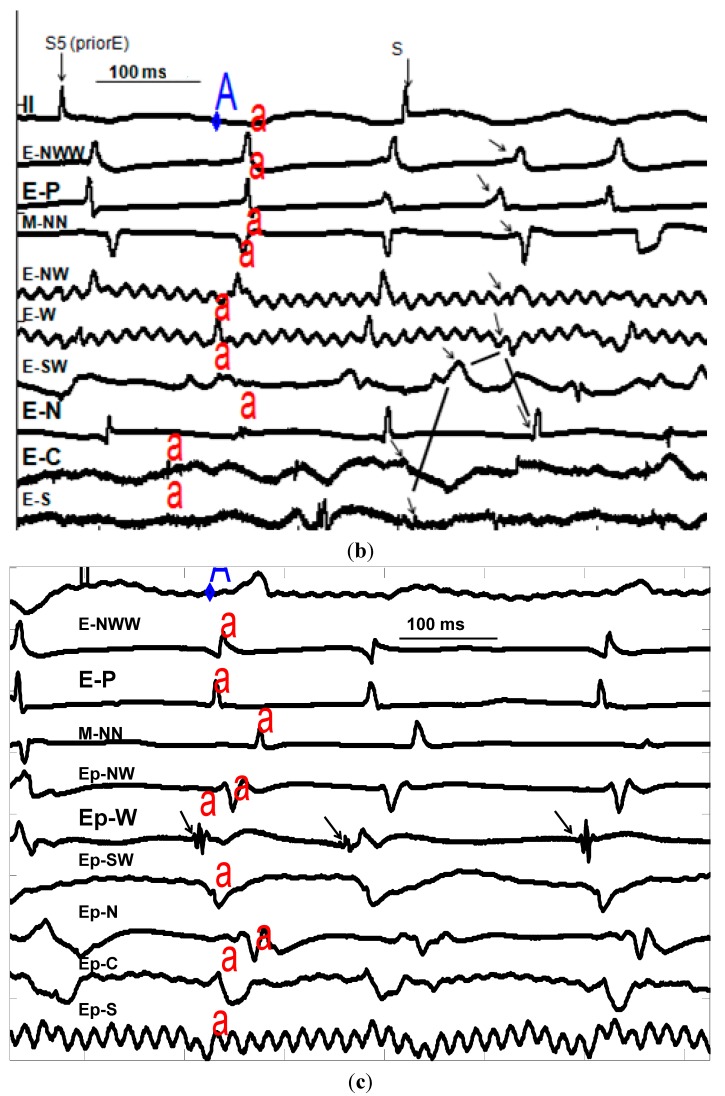
(a) Recordings from B1 (Table 4) showing two mechanisms of VT. From top to bottom are recordings from electrocardiogram (ECG) lead II for paced (*) complexes A (last drive stimulus) and B–E (4 extrastimuli) and 12 complexes of VT (F–Q) with endocardial (E-) midwall (M-) or epicardial (Ep-) electrograms from pacing site (-P) as well as west (-W), central (-C), north (-N), northeast (-NE), central east (-CE) and southeast (-SE), in the infarct zone producing this VT. Horizonal line (over E-SE) defines 200 ms. Intracardiac activations are marked with lower case letters a–q above each tracing. VT-F is produced by an endocardial focus and VT-H is due to endocardial reentry involving E-C and M-N (Figure 2). Note conduction block between E-C and M-N/E-N consistent with reentry. VT-L is due to reentry between E-CE and M-N despite surface ECG showing similar QRS. The epicardial focus (Ep-W) gives rise to VT-O (arrow). All sites of VT origin were ischemic. After BOTH drugs no focal VT/VF was induced, but reentry VT continued to be induced; (b) Electrograms from B1 (a) showing VT-H due to endocardial reentry (ER). Recordings are as 1a (larger labels same as a) with additional endocardial electrograms from extreme northwest (-NWW), extreme north (-NN), southwest (-SW), and south (-S) of the endocardial focal VT complex F (labeled A) and ER complex H (electrograms identified by arrows and activation sequences by lines). Note the conduction block between E-C and E-N which starts the reentry with circuitous activation around E-C and E-N (see Figure 2 complex H). The first stimulus (S) is complex E in 1a and the second is the next drive which does not capture; and (c) Electrograms from B1 (a) showing VT-O due to epicardial focal mechanism (EpFo). Epicardial recordings are as (a) and (b) showing VT complex O in (labeled A) with EpFo identified by arrows). Note all surrounding recordings (see Figure 2 complex O) activate by <50% of the cycle length. This VT was blocked by BOTH drugs.


