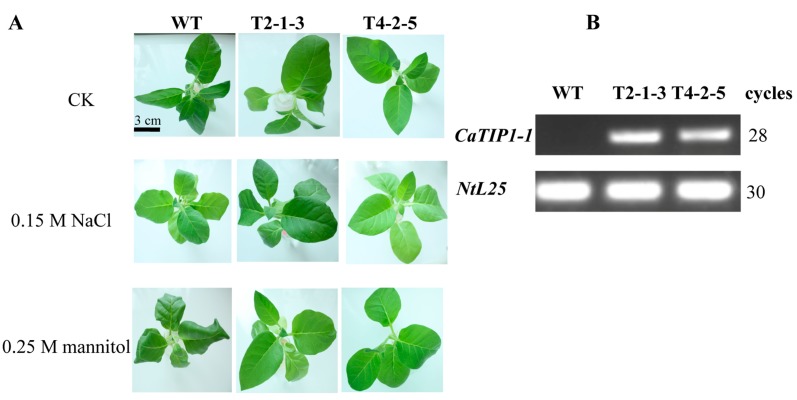
Figure 3.
Phenotype analysis and expressions of CaTIP1-1 in WT and transgenic plants. (A) Phenotype analysis of WT and T3 transgenic plants (T2-1-3 and T4-2-5 are independent transgenic lines) that were subjected to salt (0.15 M NaCl) or mannitol (0.25 M) stress for 12 h. The scale bar represents 3.0 cm; (B) Expressions of CaTIP1-1 in WT and transgenic plants (T2-1-3 and T4-2-5 are independent transgenic lines) under normal growth conditions by semi-quantitative PCR. PCR was performed for 28 or 30 cycles for different genes.

